

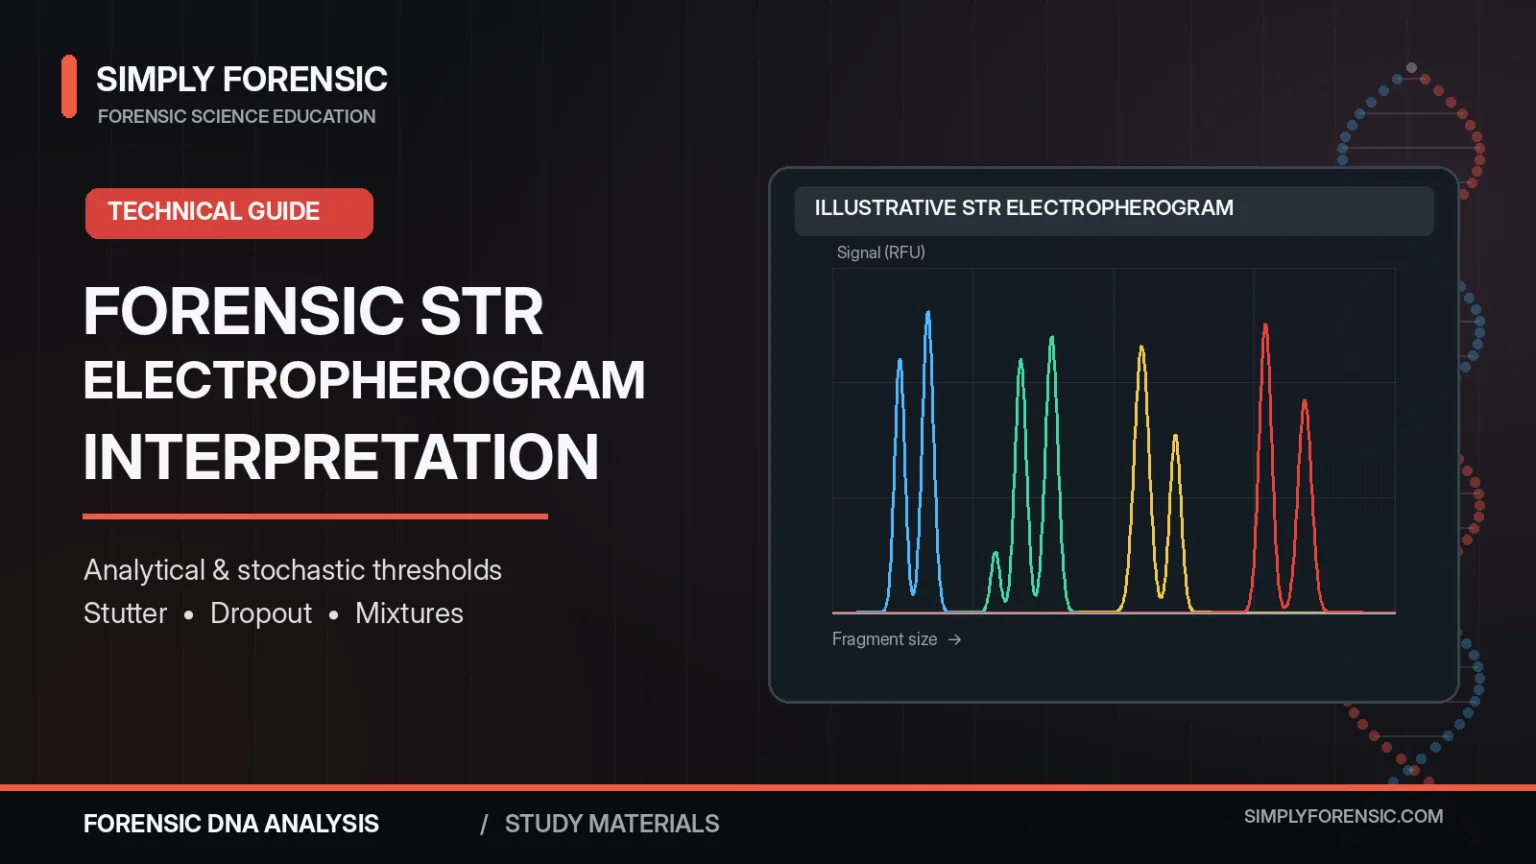
Forensic STR electropherogram interpretation transforms fluorescent DNA DNA, or Deoxyribonucleic Acid, is the genetic material found in cells, composed of a double helix structure. It serves as the genetic blueprint for all living organisms. Read Full Definition signals into scientifically supported conclusions. An electropherogram records detected fragments; it does not identify a contributor by itself. The analystA designated person who examines and analyzes seized drugs or related materials, or directs such examinations to be done; independently has access to unsealed evidence in order to remove samples from the evidentiary material for Read Full Definition must distinguish alleles
 Alleles are different forms of a gene resulting from mutations or variations in the DNA sequence or gene expression. They can be dominant (expressed with one copy) or recessive (expressed only with two copies). Read Full Definition from background and artefacts, consider possible dropout and mixtures, and only then evaluate the strength of the evidence
 Evidence is any form of proof, such as objects, materials, or scientific findings, presented to establish or disprove a fact in a legal proceeding. It is used to reconstruct events and link or exclude individuals Read Full Definition.
- Start with data quality, not a DNA comparison
- Analytical threshold versus stochastic threshold
- Infographic: From STR peak to evidential weight
- Stutter and other non-allelic peaks
- Allele dropout, drop-in and peak-height balance
- Single-source profiles and mixtures
- When does probabilistic genotyping help?
- Practical STR interpretation scenarios
- Four practical interpretation examples
- Quality assurance and reporting
- Frequently asked questions
- Is every peak above AT a genuine allele?
- Does a mixture peak above ST rule out dropout?
- Can all peaks at stutter positions be discarded?
- Does probabilistic genotyping eliminate analyst judgement?
- Selected scientific references
This guide continues our articles on STR PCR amplification and capillary electrophoresis. It follows the principles in SWGDAM’s autosomal STR interpretation guidelines, while recognising that every laboratory must apply validated procedures.
Start with data quality, not a DNA comparison
Before examining potential contributors, check the analytical run, positive and negative controls, extraction blankSpecimen or sample not containing the analyte or other interfering substances. Read Full Definition, internal size standard and allelic ladder. Confirm that peak sizing and dye separation are acceptable. Review the raw and analysed signals where necessary. A failed control or questionable sizing result can change whether a profile is suitable for interpretation.
Next, assess peak position, height, morphology and relationships among loci. A signal may be an allele, stutter, incomplete adenylation, spectral pull-up, another artefact or unresolved information. Interpretation of the evidence should generally precede comparison with a person of interest, subject to validated procedures for assumed contributors.
Analytical threshold versus stochastic threshold
Analytical threshold (AT)
The analytical threshold is a validated signal level used to distinguish potentially meaningful DNA peaks from baseline noise. It is normally established through empirical studies of background variation and the analytical system. A peak above AT becomes a candidate for evaluation; it is not automatically a true allele. Stutter, pull-up and contaminationContamination - The unwanted transfer of material from another source to a piece of physical evidence. The inadvertent touching of a weapon, thereby adding fingerprints to it is an example of evidence contamination. Read Full Definition signals can also exceed AT.
Stochastic threshold (ST)
The stochastic threshold, when used in a binary interpretation framework, addresses the risk of failing to detect one allele of a heterozygous genotype. It is not simply a higher analytical threshold. A single-source peak below a relevant stochastic criterion may warrant considering whether a partner allele dropped out.
In mixtures, shared alleles and stutter contributions can increase observed peak heights. Therefore, even a mixture peak above a laboratory’s ST cannot guarantee that all alleles from every contributor are represented. Continuous probabilistic systems may instead model dropout through their own validated approach.
No universal RFU thresholds apply. AT and ST depend on amplification chemistry, instrument, injection, software settings and internal validationValidation, often referred to as method validation, is a crucial process in the laboratory when introducing a new machine, technology, or analytical technique. It involves a series of systematic steps and assessments to ensure that Read Full Definition. Published example values are not transferable operating criteria.
Infographic: From STR peak to evidential weight
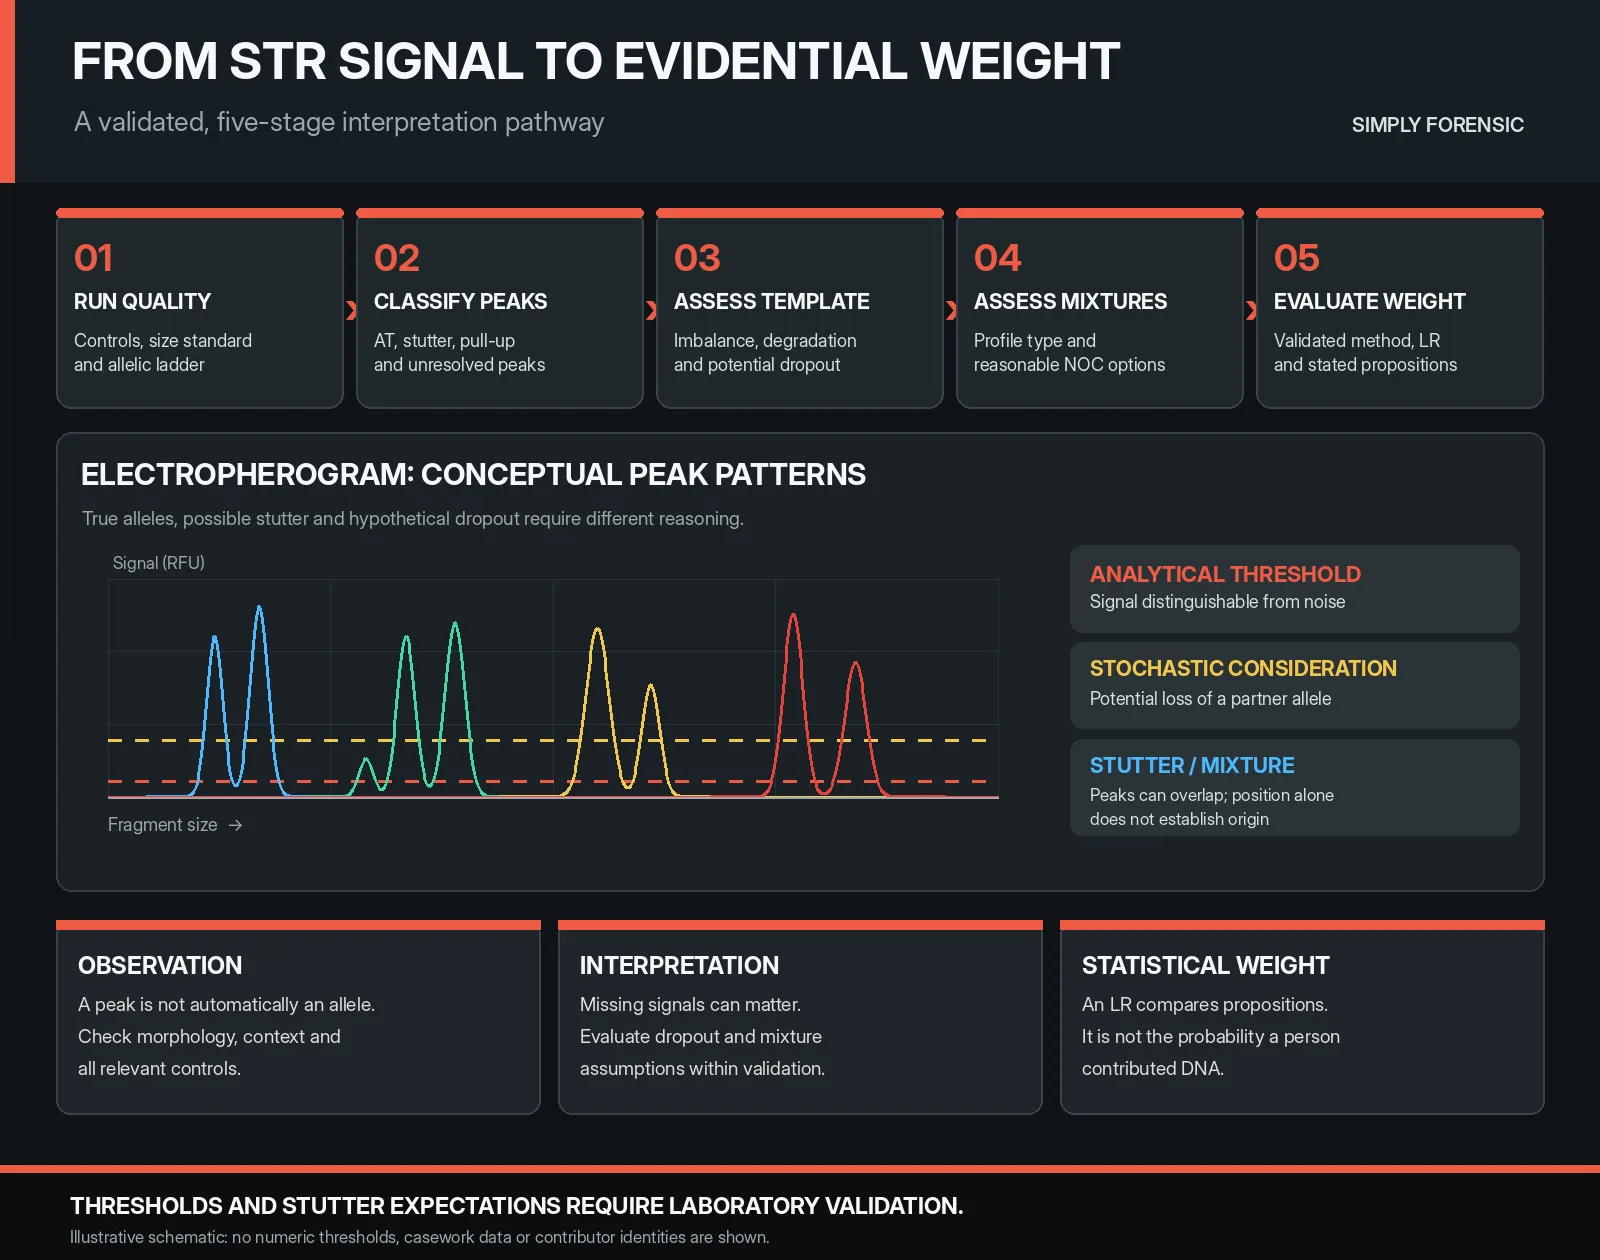
The accessible step-by-step summary below follows the same interpretation sequence.
FROM STR SIGNAL TO INTERPRETATION
Controls, size standard, ladder and instrument acceptance
AT, morphology, stutter and detection artefacts
Balance, degradation, inhibition and possible dropout
Single-source or mixture; reasonable contributor assumptions
Validated comparison, propositions and appropriate statistic
Interpretive safeguard: Thresholds, stutter expectations and mixture models are assay-, instrument- and laboratory-specific. A peak is an observation; an LR evaluates the data Information in analog or digital form that can be transmitted or processed. Read Full Definition under stated propositions.
Stutter and other non-allelic peaks
Stutter is generated mainly by polymerase slippage during STR amplification. Back stutter is usually one repeat unit shorter than a parent allele; forward and additional stutter forms may also occur. Expected peak ratios vary with locus A locus is the precise position of a gene on a chromosome. Different alleles of the same gene occupy the same locus. Read Full Definition, allele, kit and laboratory conditions. A fixed stutter percentage applied to every locus is not scientifically defensible.
A peak in a stutter position may also be a genuine allele from another contributor—or a combination of an allele and stutter. This distinction is critical in mixtures, where automatic removal can discard relevant information. Validated continuous models can accommodate stutter within a peak-height framework.
Minus-A products arise from incomplete terminal adenylation during PCR. Pull-up originates in incomplete spectral separation, sometimes accentuated by excessive fluorescence. Spikes, dye blobs, off-scale peaks and non-specific products require different diagnostic considerations. See the companion amplification artefact guide for their origins.
Allele dropout, drop-in and peak-height balance
Allele dropout means an allele from the source DNA is not detected in the resulting profile. It becomes more plausible with limited amplifiable DNA, degradation and inhibition. A single peak at a locus may represent a homozygote, but could also arise when a heterozygote’s second allele has dropped out.
Drop-in refers to an unexpected allelic signal not explained by the assumed contributor set; possible causes include sporadic contamination or other low-level effects. Analysts should not simply ignore such peaks because they contradict a proposed genotype.
For a heterozygous locus, peak-height ratio is commonly calculated as the lower peak height divided by the higher. Low template, preferential amplification, degradation, inhibition and primer-binding-site variants may all disturb balance. The qPCR concentration, degradation index and inhibition indicators provide useful context but cannot predict every missing STR allele.
Single-source profiles and mixtures
A typical single-source autosomal STR profile contains one or two alleles per locus, apart from recognised biological exceptions. Multiple loci containing more alleles than a single-source explanation can accommodate may support a mixture interpretation. Yet stutter, contamination, sequence variants and low-level artefacts must be evaluated first.
The number of contributors (NOC) is not obtained by a simple allele-count formula. Allele sharing conceals contributors, while dropout removes observable information. Three or four alleles at a locus may offer a lower bound in some circumstances, but they do not by themselves establish an exact NOC. A laboratory may evaluate more than one reasonable contributor-number assumption when warranted.
When does probabilistic genotyping help?
Binary interpretation uses validated categorical decisions about observed alleles and possible dropout. Continuous probabilistic genotyping (PG) can incorporate peak heights, expected stutter, mixture proportions and stochastic variation. Its usefulness depends on the profile, the model and the scope of the laboratory’s validation.
When competing propositions are evaluated, evidential strength is often reported as a likelihood ratio (LR). An LR compares how probable the observed data would be under the specified propositions. It is not the probability that a named individual contributed DNA, nor an identification threshold. Read our separate guide to the likelihood ratio in forensic statistics.
SWGDAM’s 2025 probabilistic-genotyping guidance and 2025 LR reporting guidance emphasise validated software, documented assumptions and careful reporting.
Practical STR interpretation scenarios
| Observation | Possible explanations | What to review |
|---|---|---|
| One allele at a locus | Homozygote; heterozygote with dropout | Signal level, stochastic considerations and other loci |
| Small peak one repeat below another | Back stutter; minor allele; both | Kit/locus stutter model and overall mixture pattern |
| Marked heterozygote imbalance | Low template, degradation, inhibition, primer-site variant | qPCR results and validated balance expectations |
| Small unexplained allele | Drop-in, contamination, minor contributor, artefact | Controls, replicates when appropriate, peak morphology |
| Peaks aligned across dye channels | Spectral pull-up; genuine signal | Raw traces, saturation and spectral performance |
| Extra alleles across loci | Mixture, stutter or artefacts | Reasonable NOC models and all locus information |
| Progressive loss of larger loci | Degradation; possibly inhibition | qPCR integrity results, IPC and profile pattern |
Four practical interpretation examples
- Single prominent allele: A strong peak with no visible partner could indicate a homozygous locus or dropout of a heterozygous partner. Review the profile as a whole and apply the appropriate laboratory stochastic framework before concluding which explanation is supported.
- Low peak at a stutter position: A smaller peak one repeat unit below another can be amplification stutter, an allele from a minor contributor, or both. Apply validated stutter expectations; position alone is insufficient to discard it.
- Several additional alleles: A locus containing more than two credible autosomal alleles may support a mixture. Check artefacts and biological exceptions, then examine the full locus set rather than deriving a precise"Precise" refers to the degree of closeness or consistency between multiple measurements or values taken under the same conditions. It indicates how well these measurements agree with each other, regardless of whether they are accurate Read Full Definition contributor count from one locus.
- Degraded partial profile: Reduced peaks at larger loci, combined with a raised qPCR degradation index, may support fragmentation. A normal internal control would not exclude every inhibitor, and a partial profile still requires an assessment of dropout risk.
Quality assurance and reporting
Interpretation procedures must be documented and supported by validation. The FBI Quality Assurance Standards effective July 2025 and ANSI/ASB 040 provide quality and protocol frameworks. PG validation is addressed by ANSI/ASB 018, while ANSI/ASB 175 addresses data associated with failed controls and contamination. Standards should be applied according to their status and the laboratory’s governing requirements.
Final statements should distinguish observed peaks, interpreted genotypes, contributor hypotheses and the statistical weight of the results. Limitations involving uncertainty, contamination, dropout or unresolved mixtures must not be hidden behind categorical wording.
Frequently asked questions
Is every peak above AT a genuine allele?
No. Artefacts and contamination can produce signals above the analytical threshold.
Does a mixture peak above ST rule out dropout?
No. Shared alleles and overlapping stutter can inflate observed signal.
Can all peaks at stutter positions be discarded?
No. A genuine contributor allele can occupy the same position.
Does probabilistic genotyping eliminate analyst judgement?
No. Analysts still evaluate data suitability, contributor assumptions, propositions, diagnostics and laboratory-specific validation.
Selected scientific references
- SWGDAM. Interpretation Guidelines for Autosomal STR Typing (2021 revision).
- Butler JC et al. DNA Mixture Interpretation: A NIST Scientific Foundation Review (NISTIR 8351, 2024).
- Gill P et al. ISFG recommendations on dropout and drop-in using probabilistic methods (2012).
- Bright JA et al. Allelic and stutter peak-height models for continuous DNA interpretation (2013).
- SWGDAM. Guidelines for the Use of Probabilistic Genotyping (2025).