

Forensic DNA DNA, or Deoxyribonucleic Acid, is the genetic material found in cells, composed of a double helix structure. It serves as the genetic blueprint for all living organisms. Read Full Definition capillary electrophoresis (CE) separates fluorescently labelled short tandem repeatA short tandem repeat is a microsatellite with repeat units that are 2 to 7 base pairs in length, with the number of repeats varying among individuals, making STRs effective for human identification purposes Read Full Definition (STR) PCR products so their sizes and dye signals can be evaluated in an electropherogram. It is the detection stage between STR amplification and interpretation. A successful CE run requires more than visible peaks: reliable size standards, allelic ladders, controls, dye separation and acceptable instrument performance are essential.
- What is capillary electrophoresis?
- From PCR product to electropherogram: the workflow
- Key components of a forensic CE instrument
- Internal size standard versus allelic ladder
- How to read an STR electropherogram
- Common CE peaks and artefacts
- Instrument calibration and quality checks
- Troubleshooting forensic CE results
- Three practical diagnostic scenarios
- Validation, documentation and reporting
- Frequently asked questions
- Does a tall CE peak mean more starting DNA?
- Are internal size standards and allelic ladders interchangeable?
- Does spectral calibration eliminate every pull-up peak?
- Should a failed electropherogram always be re-amplified?
- References and further reading
This guide explains CE principles, common instrumentation, electropherogram features and systematic troubleshooting. Instrument settings and acceptance criteria must be established for each validated laboratory workflow.
What is capillary electrophoresis?
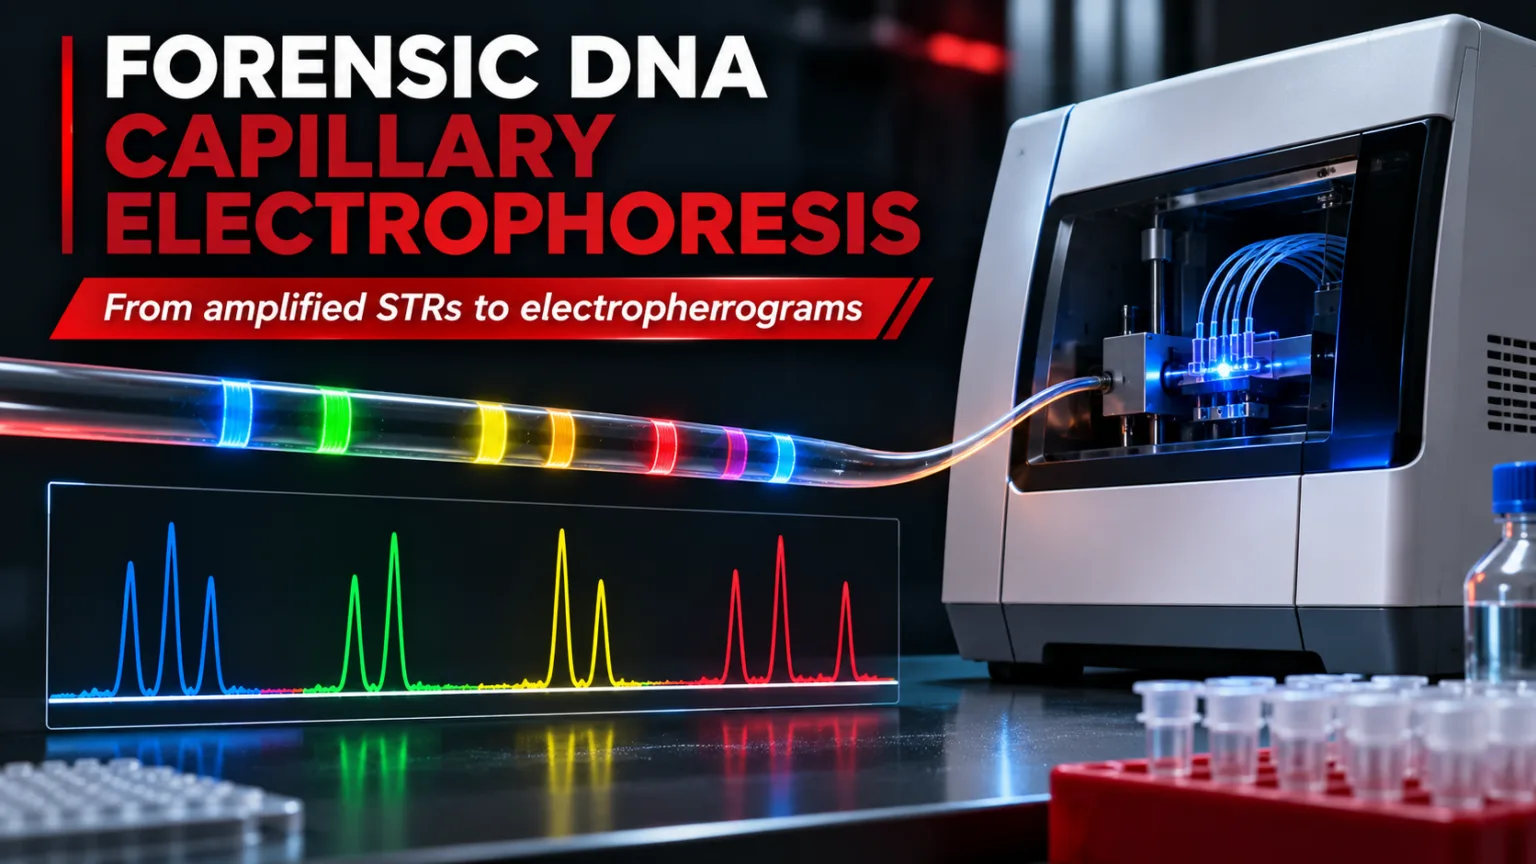
CE separates negatively charged DNA fragments in a narrow, polymer-filled capillary under an electric field. For the fragment-size range used in STR typing, smaller fragments generally migrate through the separation matrix faster than larger ones. A laser excites fluorescent dyes attached to amplified DNA fragments as they pass a detection window; emitted light is recorded by the optical detector.
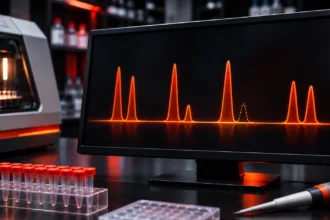
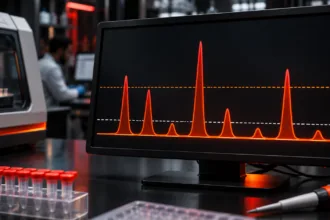
Software converts the detected signals into peaks displayed by fluorescence colour. The resulting electropherogram represents fragment size along the horizontal axis and signal intensity, commonly measured in relative fluorescence units (RFU), along the vertical axis. RFU is a detector response, not a direct measurement of DNA concentration or contributor proportion.
From PCR product to electropherogram: the workflow
- Prepare the CE sample. Combine an appropriately selected PCR product aliquotIn the forensic context, the concept of "aliquot" remains applicable but with specific relevance to handling and analyzing forensic samples and evidence. Here's how aliquots are used in forensic investigations: • Evidence Preservation: In forensic Read Full Definition with formamide and a fluorescent internal size standard according to the validated assay.
- Denature and prepare for loading. Where required, denaturation and cooling help maintain single-stranded fragments before separation. See our related article on denaturing and snap-cooling in CE.
- Electrokinetic injection. The instrument introduces DNA fragments into the capillary under specified electrical conditions.
- Polymer separation. DNA fragments migrate through the capillary and separate according to electrophoretic mobility, influenced by size and assay conditions.
- Fluorescence detection. Laser excitation and optical detection generate time-resolved multicolour signals.
- Data analysisBig Data Analytics is the process of examining extremely large and complex datasets to uncover hidden patterns and insights. In forensics, it's used to analyze massive amounts of information to investigate fraud, cybercrime, and other Read Full Definition. Software applies dye separation, identifies peaks, estimates fragment size and compares results with an allelic ladder.
Key components of a forensic CE instrument
| Component | Role in STR analysis |
|---|---|
| Capillary array | Provides the narrow separation channels; array condition affects resolution |
| Separation polymer | Acts as the molecular sieving matrix; chemistry and condition affect migration |
| Anode/cathode buffers | Support electrical conduction and stable migration |
| Autosampler and injection system | Loads wells and introduces sample electrokinetically |
| Laser, optics and detector | Excite and measure fluorescence from labelled fragments |
| Analysis software | Performs sizing, dye-channel assignment, peak detection and allele calling |
Systems such as the Applied Biosystems 3500 Genetic Analyzer use capillary arrays, a replaceable polymer system and multicolour fluorescence detection. Capillary length, polymer, dyes, injection conditions and analysis settings vary by instrument and kit; they should not be regarded as universal defaults.
Internal size standard versus allelic ladder
These two references perform different tasks and should never be confused:
| Reference | Purpose | Key check |
|---|---|---|
| Internal size standard (ISS) | Fluorescent DNA fragments of known sizes added to each sample; used to estimate sample-fragment sizes from migration behaviour | Expected peaks correctly recognised and sizing quality acceptable |
| Allelic ladder | Reference mixture containing designated STR alleles Alleles are different forms of a gene resulting from mutations or variations in the DNA sequence or gene expression. They can be dominant (expressed with one copy) or recessive (expressed only with two copies). Read Full Definition; links sized fragments to allele designations and bins | Correct ladder peak order, morphology, placement and run-specific acceptance |
Temperature, polymer composition and ionic conditions can alter migration. A sample may produce strong fluorescence yet still be unsuitable for reliable allele calling if its size standard fails. NIJ guidance describes evaluating size standards and ladders before proceeding to allele interpretation.
How to read an STR electropherogram
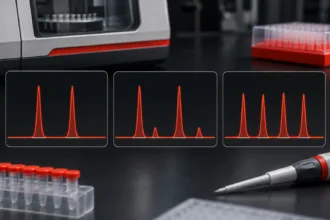
A typical profile displays coloured peaks at locations corresponding to STR loci A locus is the precise position of a gene on a chromosome. Different alleles of the same gene occupy the same locus. Read Full Definition. The analystA designated person who examines and analyzes seized drugs or related materials, or directs such examinations to be done; independently has access to unsealed evidence in order to remove samples from the evidentiary material for Read Full Definition reviews peak position, height, width, symmetry, baseline and relationships to other peaks. A tall peak does not automatically establish a contributor’s identity, and a low peak does not automatically represent noise.
For routine review, the sequence is important: examine run and control quality; check the ISS and allelic ladder; inspect raw and analysed dye-channel data Information in analog or digital form that can be transmitted or processed. Read Full Definition; identify potential non-allelic peaks; then apply validated analytical and stochastic interpretation criteria. Allele designations reflect comparison with the kit’s allelic ladder and validated sizing rules, not size alone.
The analytical threshold helps distinguish candidate signals from background under validated conditions. The stochastic threshold, where used, addresses dropout risk at heterozygous loci. Neither should be applied as an arbitrary universal RFU cutoff.
Common CE peaks and artefacts
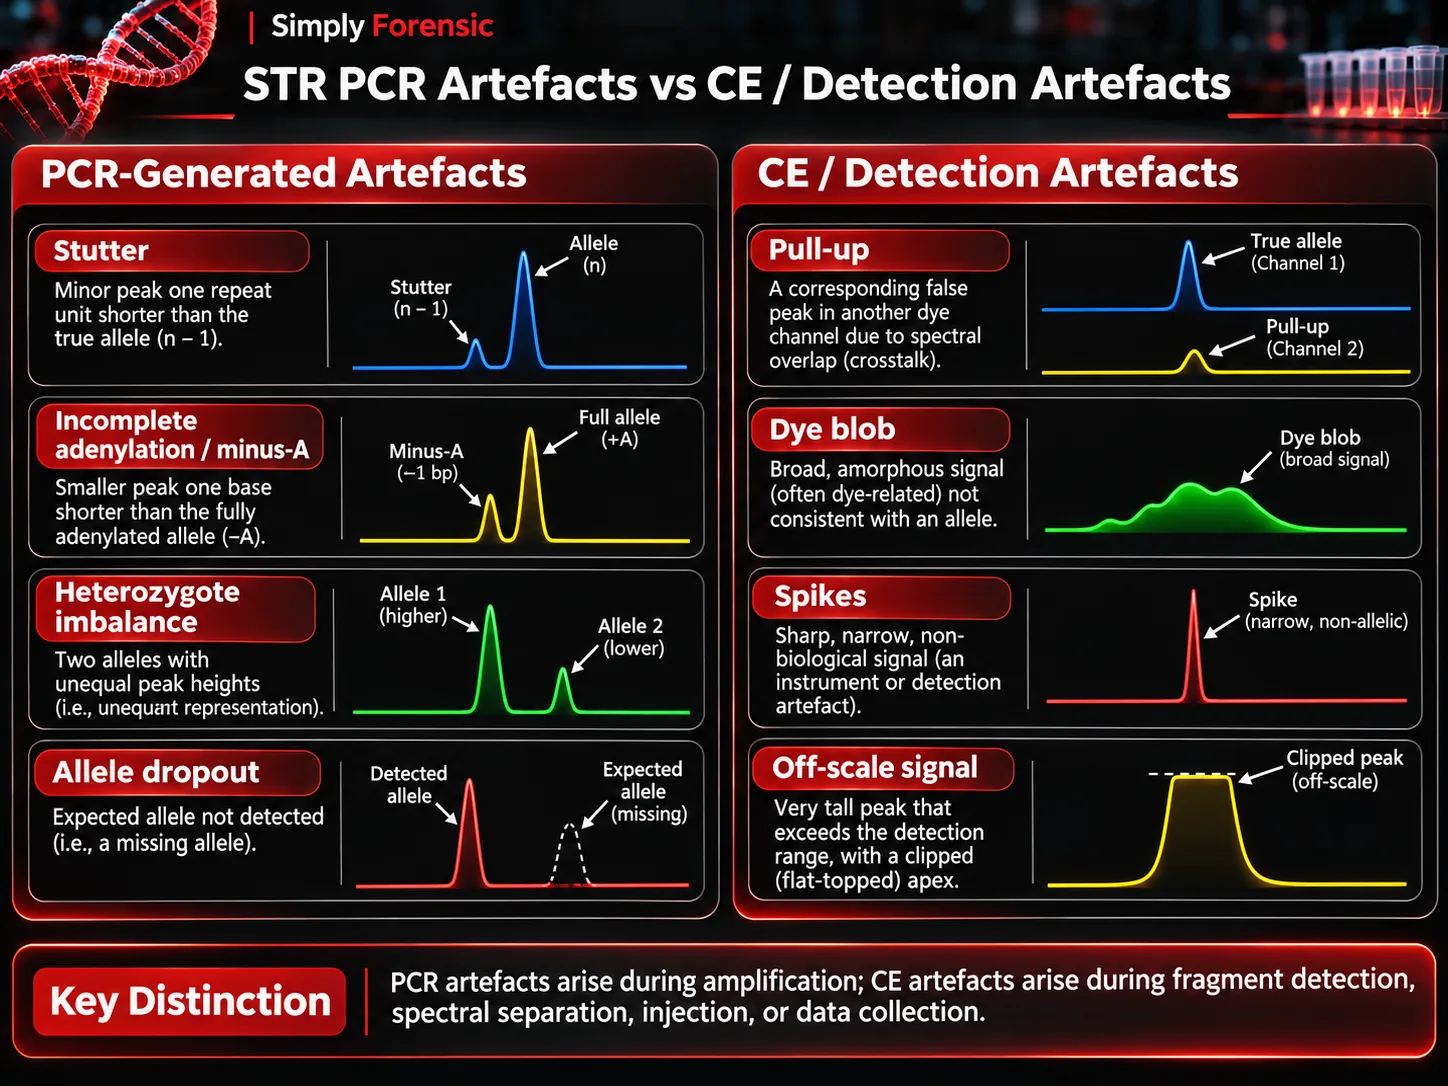
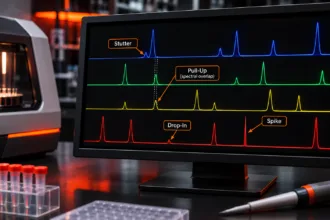
Stutter and incomplete adenylation (minus-A) originate during PCR, although they appear in CE data. In contrast, pull-up, spikes, some dye blobs and off-scale signals reflect detection, sample preparation or instrumental effects.
- Pull-up or bleed-through: An apparent peak in another colour channel at a corresponding position because fluorescence signals were incompletely separated. High signal and spectral calibrationThe act of checking or adjusting (by comparison with a standard) the accuracy of a measuring instrument. Operation that, under specified conditions, in a first step, establishes a relation between the quantity values with measurement Read Full Definition problems may contribute.
- Spikes: Often narrow transient signals associated with electronic disturbances, bubbles or other instrument events. Review raw data and whether the signal recurs.
- Dye blobs: Broad or irregular signals associated with unincorporated or dissociated fluorescent dye; they can obscure allelic peaks.
- Off-scale peaks: Signal exceeds the detector’s linear range, making peak height unreliable and sometimes increasing associated spectral artefacts.
- Broad or split peaks: May reflect high sample salt, polymer or capillary condition, sample preparation or resolution problems. Cause must be assessed rather than assumed.
Instrument calibration and quality checks
Spatial calibration identifies the positions of individual capillaries relative to the optical detector. Spectral calibration characterises fluorescence overlap among the dyes of a particular dye set so their signals can be separated computationally. A technically completed calibration is not sufficient by itself; analysts must review its quality according to instrument instructions and validated laboratory criteria.
Changes to dye set, array or optical conditions may require appropriate calibration. Instrument maintenance also involves monitoring polymer and buffer condition, capillary performance, consumable life and current or voltage behaviour. Record and investigate recurring failures rather than merely accepting repeated reinjections.
Troubleshooting forensic CE results
| Observation | Possible causes | Initial diagnostic check |
|---|---|---|
| Little or no signal in samples | Failed PCR, weak injection, capillary or instrument issue | Compare positive controlA positive control, in the context of laboratory testing and quality control, is a critical element used to validate the accuracy and reliability of an assay or experiment. It is a known sample that contains Read Full Definition, size standard, raw data and instrument run logs |
| Weak signal across the plate | Injection, polymer, buffer, capillary or optical issue | Check controls, affected capillaries and maintenance history |
| Broad or poorly resolved peaks | Salt carryover, polymer deterioration, array condition | Compare standard-only run, sample history and system consumables |
| Off-scale peaks or pull-up | Excess signal or spectral separation problem | Inspect saturation, raw channels and spectral calibration |
| Missing or misidentified ISS peaks | Preparation, injection, migration or sizing issue | Verify size-standard mix, run conditions and sizing quality |
| Peak shifts or ladder mismatch | Run conditions, size-standard or ladder assignment issue | Review sizing plots, ladder acceptance and analysis method |
| Unexpected peaks in a negative controlIn the context of laboratory testing and quality control, a negative control is a crucial component used to ensure the accuracy and reliability of an assay or experiment. It is a reference sample that should Read Full Definition | ContaminationContamination - The unwanted transfer of material from another source to a piece of physical evidence. The inadvertent touching of a weapon, thereby adding fingerprints to it is an example of evidence contamination. Read Full Definition or non-allelic artefacts | Review morphology, controls and effect on associated casework |
Corrective actions such as dilution, reinjection, fresh sample preparation, recalibration or reagent replacement should follow the laboratory’s validated procedures. Reinjection does not repair an allele that failed to amplify during PCR; similarly, re-amplification does not correct a damaged capillary or a failed size-standard assignment.
Three practical diagnostic scenarios
Scenario 1: Strong peaks with extra signals in neighbouring dye channels. Check whether peaks align across channels and whether the original channel is saturated. Review spectral calibration before treating the extra signals as additional contributors.
Scenario 2: Good PCR control, but several samples show broad peaks. Check the ISS, buffer and polymer condition, sample salt carryover and whether the problem affects particular capillaries or the entire run.
Scenario 3: A partial profile dominated by short loci. Review the qPCR degradation information and amplified product history. Poor amplification from fragmented DNA is not necessarily a CE malfunction.
Validation, documentation and reporting
Internal validationValidation, often referred to as method validation, is a crucial process in the laboratory when introducing a new machine, technology, or analytical technique. It involves a series of systematic steps and assessments to ensure that Read Full Definition should establish precision, sizing performance, sensitivityIn the context of laboratory equipment or analytical techniques, the term "sensitive" describes the capability of a machine or method to detect even very small amounts or concentrations of a substance. Sensitivity is a quantitative Read Full Definition, instrument- and method-specific artefact behaviour and relevant acceptance criteria. The FBI Quality Assurance Standards for Forensic DNA Testing Laboratories (2025) and SWGDAM guidelines support a validated, documented approach. Review and retain instrument run information, controls, calibration records and analyst decisions as required.
Frequently asked questions
Does a tall CE peak mean more starting DNA?
Not necessarily. Peak height also depends on amplification, injection, dye and detection behaviour.
Are internal size standards and allelic ladders interchangeable?
No. The ISS supports fragment sizing within each sample; the allelic ladder supports STR allele designation.
Does spectral calibration eliminate every pull-up peak?
No. Saturation and analytical limitations can still produce apparent cross-channel signals.
Should a failed electropherogram always be re-amplified?
No. Establish whether the failure originated during PCR, sample preparation, CE separation, detection or sizing before choosing a corrective action.