

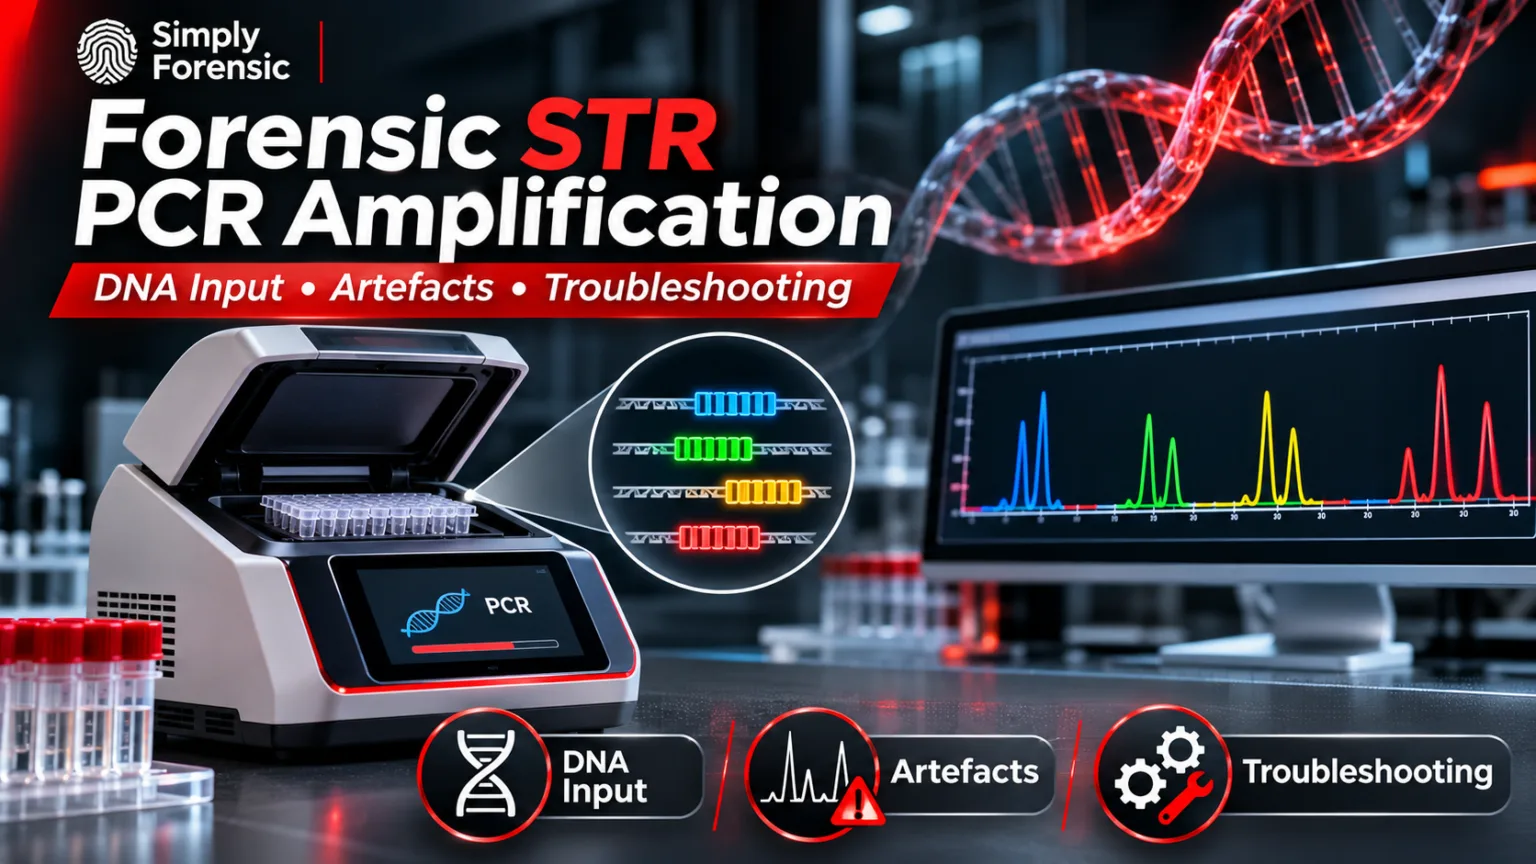
Forensic STR PCR amplification uses multiplex polymerase chain reactionA method of making multiple copies of a DNA sequence involving repeated reactions with a polymerase. Read Full Definition to copy selected short tandem repeatA short tandem repeat is a microsatellite with repeat units that are 2 to 7 base pairs in length, with the number of repeats varying among individuals, making STRs effective for human identification purposes Read Full Definition (STR) regions from human DNA DNA, or Deoxyribonucleic Acid, is the genetic material found in cells, composed of a double helix structure. It serves as the genetic blueprint for all living organisms. Read Full Definition. Fluorescently labelled products are subsequently separated by capillary electrophoresis (CE) to generate a DNA profile. Amplification quality depends on the amount and integrity of the template, primer design, reaction chemistry, thermal cycling and potential inhibitors. Understanding these factors is essential when distinguishing genuine alleles
 Alleles are different forms of a gene resulting from mutations or variations in the DNA sequence or gene expression. They can be dominant (expressed with one copy) or recessive (expressed only with two copies). Read Full Definition from artefacts and interpreting weak or partial profiles.
- Principle of multiplex STR PCR
- DNA input: too little, suitable or excessive?
- Low-template and degraded DNA
- Common PCR-related artefacts
- Stutter peaks
- Incomplete adenylation (minus-A)
- Heterozygote imbalance and allele dropout
- Primer-binding variants and null alleles
- Unexpected peaks and non-specific amplification
- PCR artefacts versus CE and detection artefacts
- Analytical threshold versus stochastic threshold
- Recognising PCR inhibition
- STR amplification troubleshooting table
- Controls, validation and reporting
- Three practical interpretation scenarios
- Frequently asked questions
- Will additional PCR cycles always improve a weak STR profile?
- Does a qPCR result guarantee successful STR amplification?
- Can a stutter peak be assumed to be a minor contributor?
- Can capillary electrophoresis artefacts be fixed by changing PCR?
- Selected scientific references
Amplification follows DNA extraction and real-time PCR quantification. This guide explains the principles and troubleshooting decisions; it is not a replacement for a laboratory-validated SOP.
Principle of multiplex STR PCR
STR loci contain short sequence motifs repeated a variable number of times. Primers bind to sequences flanking each repeat region, while a thermostable polymerase synthesises the intervening fragments. A multiplex STR kit amplifies many loci simultaneously, often including amelogenin and other markers. Fluorescent primer labels allow different products to be distinguished by dye channel and fragment size during CE. Primer concentrations, buffer conditions and cycling parameters are balanced during kit development to reduce locus-to-locus variation.
Stages of PCR amplification
- Denaturation: Heating separates double-stranded DNA into single strands.
- Annealing: Primers hybridise to complementary flanking regions.
- Extension: Polymerase adds nucleotides, copying the target regions.
Commercial systems may include enzyme activation and final extension steps. The manufacturer’s cycling programme, thermal cycler specifications and laboratory validationValidation, often referred to as method validation, is a crucial process in the laboratory when introducing a new machine, technology, or analytical technique. It involves a series of systematic steps and assessments to ensure that Read Full Definition determine suitable settings; temperatures and cycle numbers should not be transferred indiscriminately between kits.
DNA input: too little, suitable or excessive?
The qPCR concentration helps calculate the quantity introduced into an STR reaction:
DNA input (ng) = DNA concentration (ng/µL) × extract volume (µL).
This calculation assumes the qPCR estimate is suitable for the extract. Degradation and inhibition can cause a discrepancy between measured target concentration and the number of intact molecules available at individual STR loci.
At low input, random sampling increases heterozygote imbalance and allele dropout, especially for low-level mixtures. Excessive input may produce over-amplified products, exceptionally high peaks and downstream detection problems. The optimal target mass and maximum input volume depend on the kit, sample type and laboratory’s validated operating range; there is no universal number appropriate to every system.
Full- and reduced-volume reactions
Some laboratories use reduced-volume amplification after validation. Reaction-volume changes may alter pipetting precision, thermal behaviour, reagent proportions and inhibitor tolerance. A reduced-volume protocol must be supported by precision, sensitivityIn the context of laboratory equipment or analytical techniques, the term "sensitive" describes the capability of a machine or method to detect even very small amounts or concentrations of a substance. Sensitivity is a quantitative Read Full Definition and reproducibility studies rather than assuming that smaller volumes behave identically.
Low-template and degraded DNA
Low-copy samples exhibit stochastic variation because individual alleles may be represented by very few starting molecules. Increasing PCR cycles or detection sensitivity can increase signal but may also accentuate stutter, contaminationContamination - The unwanted transfer of material from another source to a piece of physical evidence. The inadvertent touching of a weapon, thereby adding fingerprints to it is an example of evidence contamination. Read Full Definition and imbalance. Such changes require validated interpretation rules and cannot eliminate stochastic uncertainty.
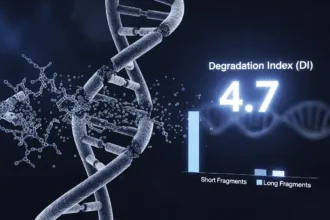
In degraded samples, shorter amplicons may survive when longer fragments have been lost. A profile with declining peak heights as product size increases may suggest degradation, but inhibition and locus-specific efficiency can produce related patterns. Consider the qPCR degradation index, extraction history and profile context together. Highly compromised bone and tooth samples may benefit from validated shorter-amplicon assays or another typing strategy.
Common PCR-related artefacts
Stutter peaks
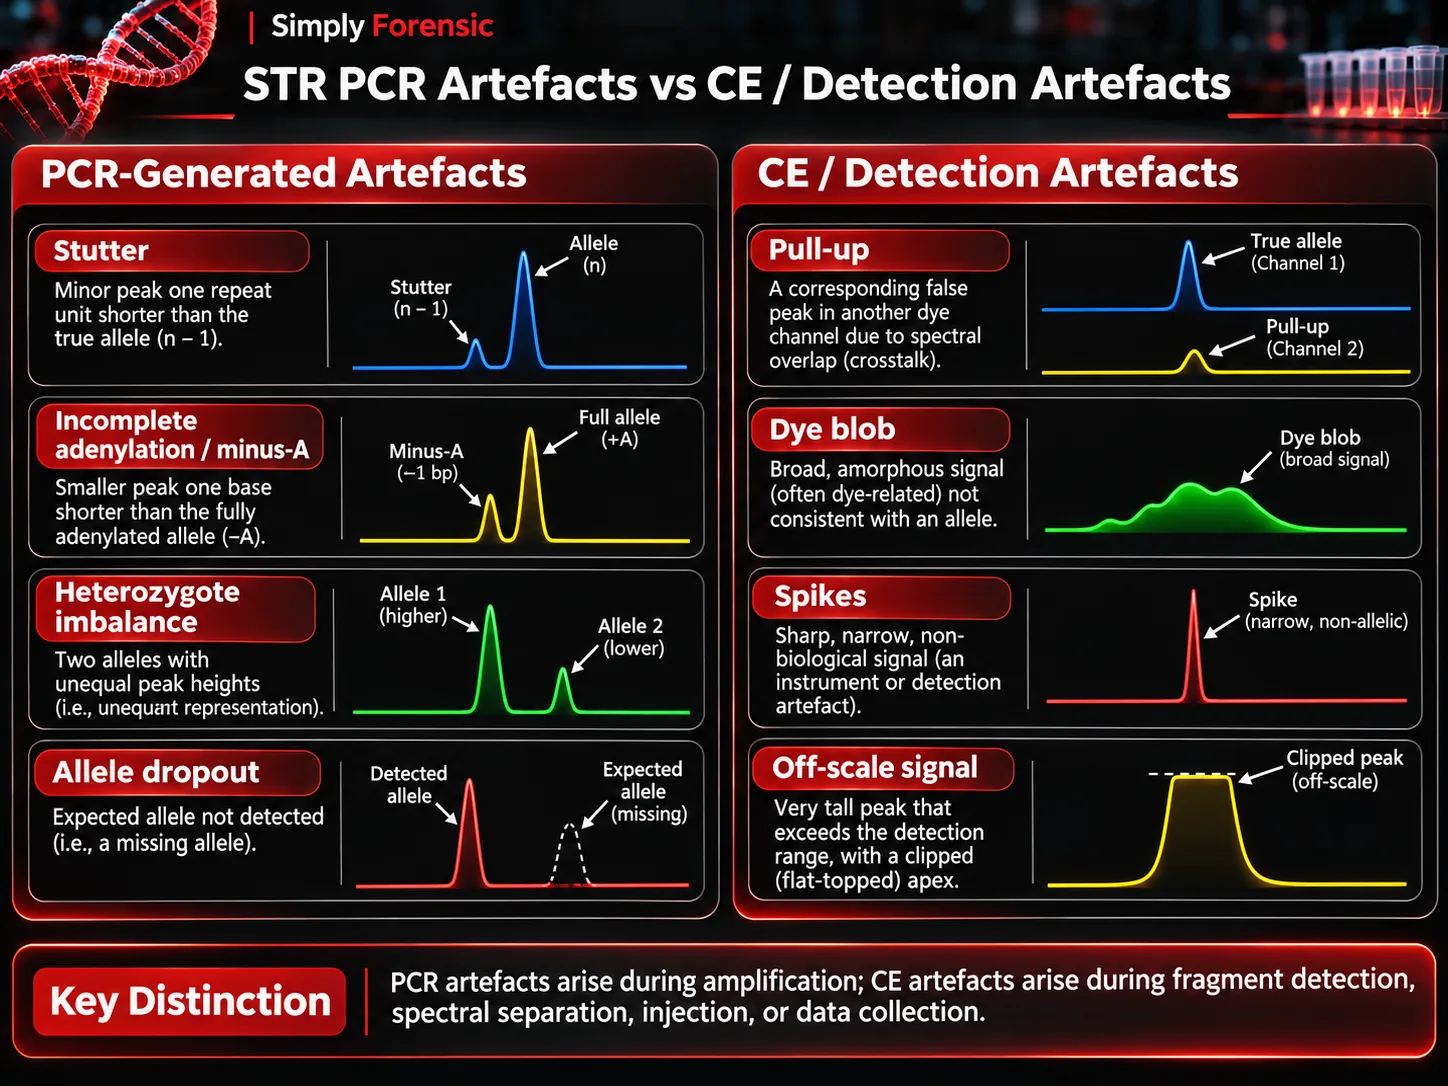
Polymerase slippage during amplification can produce stutter products, commonly one repeat unit shorter than a parent STR allele. Depending on the locus A locus is the precise position of a gene on a chromosome. Different alleles of the same gene occupy the same locus. Read Full Definition and kit, forward or additional stutter positions may also occur. Stutter ratios vary by allele, locus, kit and conditions; laboratories should use validated expectations rather than an assumed universal percentage.
Incomplete adenylation (minus-A)
Taq-family polymerases may add a non-templated adenine to PCR products. When this terminal addition is incomplete, both adenylated and non-adenylated products can appear, separated by approximately one base pair. This minus-A pattern must be distinguished from a microvariant or a genuine second allele. Reaction conditions and kit-specific final-extension behaviour influence its occurrence.
Heterozygote imbalance and allele dropout
Two alleles from a heterozygous contributor may yield unequal heights because of stochastic sampling, preferential amplification, degradation or inhibition. At sufficiently low template, an allele may fail to be detected altogether. A single visible allele does not therefore guarantee a true homozygote, particularly when signal is low or the profile is partial.
Primer-binding variants and null alleles
A sequence change within a primer-binding site may reduce or prevent amplification of one allele, producing a null allele or marked imbalance. Repeated locus-specific failure despite otherwise strong profiles warrants consideration of primer-site variation, locus-specific kit behaviour and alternative validated primer systems.
Unexpected peaks and non-specific amplification
Primer dimers or off-target products can create extraneous signals. Unexpected alleles may also originate from contamination, allele drop-in or additional contributors. Their source cannot be decided from peak presence alone; compare controls, size, dye channel, morphology and the overall profile.
PCR artefacts versus CE and detection artefacts
Not all unexpected electropherogram features arise during amplification. Spectral pull-up results from incomplete fluorescence-channel separation, while dye blobs, spikes and off-scale peaks may be associated with sample preparation, injection or detection. High PCR product abundance can contribute to saturation and pull-up during detection, but pull-up itself is not a polymerase-slippage product.
Analytical threshold versus stochastic threshold
The analytical threshold is a laboratory-established signal level used to distinguish potentially meaningful peaks from background under defined conditions. A stochastic threshold, where used, addresses the possibility that a detected allele has an undetected partner at a heterozygous locus. These thresholds answer different questions. Neither threshold alone establishes contributor number or proves that dropout is impossible; interpretation must follow the validated method and applicable mixture procedures.
Recognising PCR inhibition
Haem-related compounds, humic substances, melanin, dyes and residual extraction chemicals may interfere with PCR. Findings can include broadly reduced peaks, severe imbalance or total amplification failure. A delayed qPCR internal PCR control can support suspicion of inhibition, although a normal control does not guarantee that the downstream STR reaction is unaffected.
Validated options include dilution, cleanup or re-extraction. Dilution reduces inhibitors but also reduces DNA; increasing extract volume can introduce more inhibitor. Where only trace material is available, these trade-offs are particularly important.
STR amplification troubleshooting table
| Observation | Possible explanation | Review or action |
|---|---|---|
Evidence Evidence is any form of proof, such as objects, materials, or scientific findings, presented to establish or disprove a fact in a legal proceeding. It is used to reconstruct events and link or exclude individuals Read Full Definition and positive controlA positive control, in the context of laboratory testing and quality control, is a critical element used to validate the accuracy and reliability of an assay or experiment. It is a known sample that contains Read Full Definition both fail | Reagent, thermal cycler or downstream detection problem | Check batch preparation, control history, thermal cycling and CE performance |
| Positive control works; evidence fails | Low DNA, degradation or inhibition | Review qPCR, IPC, extraction and validated recovery options |
| Short loci stronger than long loci | Degradation, inhibition or size-related biasThe difference between the expectation of the test results and an accepted reference value. Read Full Definition | Compare qPCR DI and IPC; evaluate validated shorter targets |
| Single locus repeatedly weak | Primer-binding variation or locus-specific performance | Assess replicates and validated alternative kit/primer system |
| Unexpected peaks in negative controlIn the context of laboratory testing and quality control, a negative control is a crucial component used to ensure the accuracy and reliability of an assay or experiment. It is a reference sample that should Read Full Definition | Contamination or analytical artefact | Investigate source and effect on associated samples before acceptance |
| Off-scale peaks and pull-up | Excess product, injection or spectral issues | Review input, CE settings and validated reanalysis options |
Controls, validation and reporting
Positive amplification controls demonstrate expected assay performance; negative amplification controls monitor contamination introduced during PCR setup. Extraction blanks address potential contamination introduced earlier in processing. Separation of pre- and post-PCR work areas, documented cleaning and controlled consumables remain essential.
Internal validation evaluates sensitivity, precision, reproducibility, mixtures, inhibitor effects, degraded templates, stutter, thresholds and contamination behaviour as applicable. Laboratories should document conditions and acceptance criteria before applying them to casework. Relevant frameworks include the FBI Quality Assurance Standards (2025) and SWGDAM guidance.
Three practical interpretation scenarios
Scenario 1: Low-template touch DNA. An apparently single-source profile contains one strong allele and a substantially weaker allele at several loci. Before treating the pattern as a biological imbalance, assess the qPCR estimate, signal level, potential dropout and validated stochastic criteria. A repeat amplification may yield different peaks because aliquots do not contain identical template molecules.
Scenario 2: Weathered biological stain. Short amplicons amplify while longer loci are weak or absent. Correlate this size-related loss with the degradation index and inhibition indicators. More cycles cannot reconstruct fragments already lost through degradation.
Scenario 3: High-signal reference sampleReference sample - material from a verifiable/documented source which, when compared with evidence of an unknown source, shows an association or linkage between an offender, crime scene, and/or victim. Read Full Definition. Several peaks are off-scale and smaller signals appear in other colour channels at corresponding fragment sizes. Check raw signal and spectral separation before classifying these as additional alleles. Validated dilution or re-injection may help characterise the problem.
Frequently asked questions
Will additional PCR cycles always improve a weak STR profile?
No. Signal may rise, but stochastic variability, contamination and artefacts may also become more pronounced.
Does a qPCR result guarantee successful STR amplification?
No. qPCR measures particular targets and cannot guarantee that each STR locus is intact or uninhibited.
Can a stutter peak be assumed to be a minor contributor?
No. Compare its size and height with validated stutter expectations and the complete profile before interpreting additional contributors.
Can capillary electrophoresis artefacts be fixed by changing PCR?
Not necessarily. First establish whether the observed issue arose during amplification, injection, spectral separation or data analysisBig Data Analytics is the process of examining extremely large and complex datasets to uncover hidden patterns and insights. In forensics, it's used to analyze massive amounts of information to investigate fraud, cybercrime, and other Read Full Definition.
Selected scientific references
- McDonald C, Taylor D, Linacre A. PCR in Forensic Science: A Critical Review. Genes
 Genes are DNA segments (or RNA in some viruses) that dictate cellular processes, traits, and hereditary information, promoting genetic diversity and evolution in living organisms. Read Full Definition. 2024;15:438.
- Alaeddini R. Forensic implications of PCR inhibition: A review. Forensic ScienceDiscover the fascinating field of Forensic Science, the application of scientific principles to legal matters. This post delves into its many disciplines, from DNA analysis to crime scene investigation, its importance in the justice system, Read Full Definition International: Genetics. 2012.
- National Institute of Standards and Technology. Basic STR Interpretation Workshop. Educational material on stutter, null alleles and incomplete adenylation.
- Scientific Working Group on DNA Analysis Methods. Autosomal STR interpretation and validation guidelines.
- Federal Bureau of Investigation. Quality Assurance Standards for Forensic DNA Testing Laboratories. Effective July 2025.