


STR artefacts in forensic DNA profiling DNA profiling, also known as DNA fingerprinting, is a significant technique in forensic science that identifies individual's unique DNA patterns for various purposes such as establishing familial relationships or tracing genealogical roots. The technique, which Read Full Definition are signals or patterns that can resemble true alleles
 Alleles are different forms of a gene resulting from mutations or variations in the DNA sequence or gene expression. They can be dominant (expressed with one copy) or recessive (expressed only with two copies). Read Full Definition, obscure genuine information or interfere with peak-height interpretation. Some originate during polymerase chain reactionA method of making multiple copies of a DNA sequence involving repeated reactions with a polymerase. Read Full Definition (PCR), such as stutter and incomplete adenylation. Others occur during capillary electrophoresis (CE) and fluorescence detection, including spectral pull-up, dye blobs and narrow spikes. A reliable interpretation must identify the most plausible source of a signal without automatically labeling every extra peak an additional contributor—or discarding a genuine allele simply because it occupies an artefact position.
- What counts as an STR artefact?
- Infographic: classify the signal by likely source
- Stutter peaks: PCR slippage, direction and interpretation
- Back stutter, forward stutter and additional products
- How to calculate a stutter ratio
- How stutter can hide a minor contributor
- Incomplete adenylation: the minus-A and plus-A pattern
- Spectral pull-up: when one dye appears in another channel
- Dye blobs: broad non-allelic fluorescent signals
- Spikes and transient electrophoresis abnormalities
- Off-scale peaks, saturation and related distortions
- Drop-in, contamination and unexpected additional alleles
- Do not confuse an artefact with dropout, imbalance or a variant allele
- Worked examples: recognising the likely explanation
- Example A: why peak position alone cannot prove stutter
- Example B: a solitary extra peak is not a diagnosed contaminant
- Example C: choosing the right rework step
- Laboratory troubleshooting: from symptom to response
- Systematic review workflow for peak classification
- Validation, training and quality assurance
- Reporting artefacts without overstating conclusions
- Frequently asked questions
- Scientific references and further reading
- Related Simply Forensic guides
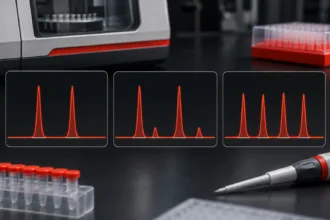
This laboratory-oriented guide focuses on recognition, differentiation, documentation and troubleshooting. It complements our STR PCR amplification guide, CE troubleshooting guide, electropherogram interpretation guide and analytical and stochastic threshold guide. The numerical examples and illustrated peak patterns are synthetic teaching examples, not actual casework or laboratory-approved acceptance limits.
KEY LEARNING POINTS
- Stutter is a PCR product arising from repeat slippage; its size and relative signal can resemble a minor contributor allele.
- Pull-up, dye blobs and spikes are primarily detection/chemistry anomalies requiring different checks.
- Drop-in is an unexpected allelic observation or explanatory hypothesis, not a distinctive peak shape that establishes its own cause.
- Allelic dropout is missing information and should not be confused with an extraneous peak.
- Peak morphology, raw data
 Information in analog or digital form that can be transmitted or processed. Read Full Definition, controls, replicate findings and validated method-specific expectations matter more than a single RFU percentage.

What counts as an STR artefact?
The NIST OSAC Lexicon describes STR artefacts broadly as non-allelic amplification products, detection anomalies or by-products of primer synthesis that appear on an electropherogram. The classification helps locate the potential origin of a problem, but not every anomalous profile feature is technically an artefact. A low signal consistent with allele dropout represents failure to detect an allele; an extra allele arising from extraneous DNA DNA, or Deoxyribonucleic Acid, is the genetic material found in cells, composed of a double helix structure. It serves as the genetic blueprint for all living organisms. Read Full Definition may be genuine DNA that does not belong to the evidentiary contributor of interest.
| Observation | Possible origin | Typical clue | Critical caution |
|---|---|---|---|
| Back/forward stutter | Polymerase slippage during STR amplification | Peak at a characteristic repeat offset from parent allele | A genuine minor allele can overlap the stutter position |
| Incomplete adenylation (−A) | Partial non-templated nucleotide addition | Split products separated by about 1 bp | Not a second full-repeat STR allele |
| Spectral pull-up | Imperfect fluorescence spectral separation; saturation can aggravate it | Aligned signals in different dye channels | Co-migration does not automatically prove pull-up |
| Dye blob | Unincorporated or released fluorescent dye associated with primer chemistry | Often broad, dye-associated, characteristic size range | Can overlap true allelic regions |
| Spike | Electrical, injection, polymer or detection anomaly | Very narrow, often simultaneous in several channels | Some spikes appear only in one channel |
| Off-scale/saturation | Signal above linear detection capability | Flat top, distorted shape, unreliable peak height | Ratios calculated from clipped heights are unreliable |
| Drop-in | Unexpected allelic event, often considered in low-template interpretation | Unexplained allele that may be non-reproducible | May be contaminationContamination - The unwanted transfer of material from another source to a piece of physical evidence. The inadvertent touching of a weapon, thereby adding fingerprints to it is an example of evidence contamination. Read Full Definition or a contributor; the cause cannot be read from shape alone |
| Allele dropout | Insufficient amplifiable target or stochastic/damaged template | Expected allele missing or below detection | An absence cannot be directly observed as an extra peak |
In practice, a peak could satisfy more than one explanation. Analysts should record alternative hypotheses where they remain relevant instead of treating the artefact labels as visually infallible diagnoses.
Infographic: classify the signal by likely source
STR PEAK TROUBLESHOOTING · FIRST CLASSIFICATION
A practical visual route from an unusual electropherogram observation to the appropriate laboratory review. These are diagnostic categories, not certain peak identities.
01 · PCR-origin products
Stutter: repeat-unit offset from a parent allele.
−A/+A: approximately 1 bp split from incomplete adenylation.
Check: locus A locus is the precise position of a gene on a chromosome. Different alleles of the same gene occupy the same locus. Read Full Definition, parent allele, PCR conditions and validated stutter expectations.
02 · CE and dye effects
Pull-up: aligned signal in another dye channel.
Spike: unusually narrow transient signal.
Dye blob: often broad fluorescence anomaly.
Check: raw trace, sizing, saturation and calibrationThe act of checking or adjusting (by comparison with a standard) the accuracy of a measuring instrument. Operation that, under specified conditions, in a first step, establishes a relation between the quantity values with measurement Read Full Definition.
03 · Allelic uncertainty
Unexpected allele: possible minor contributor, background DNA or drop-in.
Missing allele: possible dropout, not an extra peak.
Check: controls, case context, replicates where validated and the full profile.
Do not remove a peak solely because it resembles a known artefact. Record the observation, evaluate competing explanations, and apply laboratory-approved criteria.
Stutter peaks: PCR slippage, direction and interpretation
Back stutter, forward stutter and additional products
Stutter forms when repetitive DNA strands slip and re-pair out of register during PCR. The most familiar product is back stutter, often one repeat unit shorter than the parent allele. For a common tetranucleotide STR, one repeat unit is four base pairs; however, STR kits contain loci with differing repeat structure, including complex and non-tetranucleotide patterns. Forward stutter occurs at a longer product length. Less common products may be two repeat units away or reflect locus-specific repeat structures.
Stutter expectations can depend on repeat motif, uninterrupted repeat length, allele length, sequence structure, assay and conditions. A fixed “15% back stutter” or “5% forward stutter” rule for every STR locus is not universally valid. The NIJ STR training material explains the role of repeat length, structure and allele size in stutter formation; subsequent research has developed allele-specific models.
How to calculate a stutter ratio
For an observed parent allele of 2,500 RFU and a smaller peak one repeat below it measuring 225 RFU, the observed ratio is:
Observed stutter-position ratio = (225 ÷ 2,500) × 100 = 9.0%.
The calculation reports a measured ratio; it does not prove that all 225 RFU originated from stutter. If a minor contributor also has an allele at the same position, the peak may be a composite of stutter and genuine allelic signal. Compare it with validated locus/allele-specific expectations and assess the rest of the profile before classifying the position.
How stutter can hide a minor contributor
Suppose a strong allele 16 is detected at 2,500 RFU, and the one-repeat-shorter position 15 has a 360 RFU peak. Even if the observed ratio is compatible with a published maximum or exceeds a particular laboratory filter, this alone cannot resolve whether the 15 signal is all stutter, a true allele or both. Other loci, mixture balance and validated models can help test the alternatives. A software filter that automatically deletes stutter-position peaks may discard genuine minor-contributor information.
Probabilistic genotyping systems can incorporate models of stutter and peak-height distributions, subject to internal validationValidation, often referred to as method validation, is a crucial process in the laboratory when introducing a new machine, technology, or analytical technique. It involves a series of systematic steps and assessments to ensure that Read Full Definition. They are not guaranteed to rescue an unreliable electropherogram or to identify exactly how much of a composite peak came from each source. The NIST scientific foundation review identifies stutter, stochastic variation and allele sharing as major sources of DNA-mixture complexity.
Incomplete adenylation: the minus-A and plus-A pattern
Many PCR polymerases used in forensic STR typing add a non-templated nucleotide—commonly adenine—to amplified fragments. When addition is incomplete, two amplified products may be observed: a fully adenylated +A product and a −A product that is approximately 1 base pair shorter. This is different from a tetranucleotide back-stutter product, which is typically one full repeat (often 4 bp) shorter than its parent allele.
A synthetic example has two nearby peaks in the same dye channel: a +A product at an apparent 249.4 bp with height 1,680 RFU and a −A product at about 248.4 bp with height 520 RFU. If the base-pair separation, size, peak morphology and expected kit behaviour support incomplete adenylation, these two signals should not automatically be interpreted as two independent alleles.
Incomplete adenylation is influenced by PCR chemistry and conditions, including terminal extension and excessive template. Changes to amplification conditions must follow the manufacturer’s instructions and the laboratory’s validation. An experimental rapid-PCR study by Vallone, Steffen and Butler documented incomplete adenylation at several loci, demonstrating that amplification conditions can influence this effect.
Spectral pull-up: when one dye appears in another channel
Multiplex STR assays label PCR products with different fluorescent dyes. The instrument and software separate overlapping emission spectra during detection. If the spectral calibration or signal separation is imperfect, a strong primary signal may produce an apparent secondary peak in another dye channel; this is called pull-up or bleed-through. Very high fluorescence and signal saturation can worsen the problem.
For example, a blue-channel peak of 7,800 RFU and a green-channel signal of 210 RFU aligned at the same scan position could raise suspicion of pull-up. Their observed height ratio is approximately 2.7%, but there is no universal percentage that decides every pull-up event. Inspect raw and processed traces, relative migration position, the primary peak’s intensity or saturation, spectral performance and surrounding loci. An allele could genuinely migrate at the same size in another channel, so alignment is strong diagnostic evidence Evidence is any form of proof, such as objects, materials, or scientific findings, presented to establish or disprove a fact in a legal proceeding. It is used to reconstruct events and link or exclude individuals Read Full Definition but not conclusive proof.
The NIJ technical guidance on pull-up discusses checking dye separation and saturation and considering validated reinjection or lower-input processing where appropriate. If the same problem affects multiple samples and dye channels, review run-level spectral calibration and detector performance rather than repeatedly amplifying every sample.
Dye blobs: broad non-allelic fluorescent signals
Dye blobs may arise from unincorporated or disassociated fluorescent primer dye species and commonly differ in shape from properly sized amplified alleles. They often appear broader, occur in a characteristic region or dye channel, and can mask genuine peaks if they overlap the allele-size range. They should not be diagnosed merely by low height: some dye artefacts can be sufficiently prominent to interfere with interpretation.
Review the size region, morphology, behaviour across samples, kit or reagent age, controls and expected artefact characteristics. NIJ’s dye-blob guidance describes the generally broad morphology and potential relationship to fluorescent primer dye chemistry. Any cleanup, reamplification or alternative processing must be validated and compatible with available material. A peak should not be removed solely because it is inconvenient or difficult to explain.
Spikes and transient electrophoresis abnormalities
Spikes are usually sharp, narrow signals associated with the detection or electrophoresis process rather than amplified STR alleles. Potential causes include electrical fluctuations, microbubbles or contaminants in polymer or formamide. They may coincide in scan position across multiple dye channels, although single-channel spikes also occur.
A suspected spike may look markedly narrower than typical allelic peaks and can have steep, unnatural slopes. Raw data may reveal these characteristics more clearly than processed peak tables. If the signal interferes with interpretation, a validated reinjection can help assess reproducibility, but the original result and analystA designated person who examines and analyzes seized drugs or related materials, or directs such examinations to be done; independently has access to unsealed evidence in order to remove samples from the evidentiary material for Read Full Definition reasoning must be retained. Absence on reinjection supports a transient explanation; it does not establish the identity of every other peak. The NIJ spike tutorial recommends careful inspection of raw and analysed data.
When repeated spiking occurs across a run or capillary, investigate instrument and reagent condition, preparation and documented maintenance rather than classifying each anomaly in isolation.
Off-scale peaks, saturation and related distortions
Very strong fluorescence can exceed the linear performance of a detector or analysis system. Off-scale or saturated signals may appear flat-topped, broadened or distorted, and can generate secondary channel artefacts. Reported peak heights may no longer represent the true proportional fluorescence intensities; therefore, they are unsuitable for direct peak-height balance, stutter-ratio or mixture-proportion calculations unless the validated procedure specifically addresses them.
Review the quality of the original profile, DNA input, cycle conditions, injection parameters and instrument calibration. Depending on the cause and the laboratory’s validated method, appropriate actions might include reinjecting a diluted amplification product, using a shorter validated injection, or reamplifying with a lower DNA input. The original data must remain part of the case record, and a modified analytical condition should not be treated as an unvalidated quick fix.
Drop-in, contamination and unexpected additional alleles
Drop-in is an observed additional allelic signal not accounted for by an assumed contributor set, or a hypothesis that an unexpected low-level peak arose outside those donors. It is often encountered in low-template DNA interpretation and may be sporadic or non-reproducible. However, an unexplained peak does not identify its own origin. The observation could instead reflect DNA from an additional contributor, carryover or background DNA, contamination, stutter overlap, or an artefact that was incorrectly classified.
This differs from gross contamination, which can contribute multiple coherent alleles resembling a partial or full profile. A clean extraction or amplification negative controlIn the context of laboratory testing and quality control, a negative control is a crucial component used to ensure the accuracy and reliability of an assay or experiment. It is a reference sample that should Read Full Definition is valuable but does not prove contamination or drop-in was impossible in the sample. A single extra allele should not be removed just because it conflicts with a known reference genotype. The ISFG recommendations on dropout and drop-in explain why evidential weight should be evaluated under appropriately validated alternative hypotheses and uncertainty models.
When investigating an unexpected peak, review all controls, processing history, sampling conditions, any replicate analysis, possible shared alleles and the entire profile. A single reamplification may give different low-template results owing to stochastic sampling; repeatability is informative but not a simple yes/no proof of the peak’s origin.
Do not confuse an artefact with dropout, imbalance or a variant allele
Allelic dropout is failure to observe an allele above the analytical detection criterion; it is not a visible false peak. It becomes more plausible with limited template, degradation, inhibition, unequal sampling and other stochastic effects. An apparently homozygous locus may represent a true homozygote or a heterozygote missing one detected allele. See our threshold guide for how binary procedures address the risk.
Heterozygote imbalance is unequal peak height from alleles of a heterozygous source; it can arise from stochastic PCR amplification or other locus- and sample-dependent factors. It is not itself proof of two contributors or an artefact peak. Off-ladder alleles, tri-allelic patterns and primer-binding-site variants also require specialist review. They may reflect genuine sequence or chromosomal findings rather than data-processing errors. Neither an unfamiliar size designation nor an extra peak authorizes automatic deletion.
Worked examples: recognising the likely explanation
| Synthetic observation | Most relevant possibilities | First checks | What not to conclude |
|---|---|---|---|
| Allele 16 = 2,500 RFU; one-repeat-shorter 15 = 225 RFU | Back stutter, genuine 15 allele, or combined signal | Locus-specific stutter model; other loci; possible minor component | “9% automatically proves stutter” |
| Blue peak 7,800 RFU; green peak 210 RFU at matching scan position | Spectral pull-up; coincident genuine allele | Raw/analysed channel alignment, saturation, spectral calibration | “Any aligned peak must be pull-up” |
| Two same-dye peaks separated by about 1 bp | Incomplete adenylation; other size-related anomalies | Expected allele size, −A/+A morphology, PCR context | “Two peaks represent two STR repeat alleles” |
| Broad signal within a fluorescent dye channel | Dye blob or another non-allelic peak | Morphology, size range, reagent/control history | “Broad peak means contamination” |
| Narrow signal seen simultaneously across several channels | Transient spike or other detection event | Raw traces, scan position, validated reinjection | “The spike is a new contributor” |
| One unexplained 160 RFU allele in a low-template profile | Minor contributor, contamination/drop-in, or artefact | Controls, amplification replicates, locus context and validated rules | “The peak must be drop-in and can be ignored” |
Example A: why peak position alone cannot prove stutter
Suppose locus X contains allele 13 at 1,500 RFU and a peak at allele 12 measuring 195 RFU. The ratio is 195/1,500 × 100 = 13.0%. If this signal lies one full repeat below 13, it occupies a plausible stutter position. Yet whether 13% is expected requires information about this locus, allele and validated system. In a mixture, the observed signal could contain both a stutter product and a genuine allele from a weaker donor. The correct response is not to apply an arbitrary universal percentage, but to assess the composite explanation.
Example B: a solitary extra peak is not a diagnosed contaminant
Imagine an otherwise interpretable profile shows one additional allele at 160 RFU. A negative control is clean, and the allele is not found in the assumed single donor. It remains an unexplained allelic observation pending review. The analyst should consider unrecognized contributors, contamination, stochastic or artefactual explanations and the laboratory’s documented criteria. “Negative control clean” does not prove the signal is genuine; “not in reference profile” does not prove it is contamination.
Example C: choosing the right rework step
A strong set of blue-channel peaks has corresponding smaller peaks in adjacent dyes and evidence of saturation. The likely issue may arise during detection rather than DNA extraction. Reviewing spectral performance and performing a validated reinjection with an appropriate sample loading could be more informative than re-extracting the original evidence. By contrast, a profile dominated by shorter fragments with depleted larger loci may instead reflect degradation; repeated CE runs cannot recreate missing template. Identify the stage of failure before deciding the stage of repeat processing.
Laboratory troubleshooting: from symptom to response
| Symptom | Review | Possible validated response |
|---|---|---|
| Recurring pull-up across a run | Off-scale peaks, spectral calibration, dye-channel alignment | Review calibration, injection and loading; repeat or recalibrate as authorized |
| Persistent broad dye-related peaks | Primer/reagent age, kit handling, sizing pattern | Assess reagent condition and compatible cleanup or re-amplification |
| Multiple very narrow peaks in one capillary | Raw-data scan alignment, polymer, formamide, bubbles, instrument | Validated reinjection, reagent checks, maintenance if persistent |
| Frequent −A split peaks | Template input, PCR thermal profile and final extension | Review PCR conditions and manufacturer/validation specifications |
| Unexpected higher stutter ratios | Locus/allele models, saturation, low template, mixture contributions | Do not silently change filters; evaluate profile and validated model |
| Extra allele in a blankSpecimen or sample not containing the analyte or other interfering substances. Read Full Definition | Stage of blank, batch history, sample handling, controls | Follow contamination investigation, hold/rework rules and documentation |
| Weak or partial profile without clear artefact peaks | qPCR, degradation, inhibition, low-template stochastic variation | Consider validated re-amplification, cleanup or re-extraction as relevant |
Results of a repeat should supplement, not overwrite, the initial analytical record. Any changes to accepted peak classifications should be documented and technically reviewed according to the laboratory’s SOP. A repeat that happens to fit a person of interest better is not, by itself, evidence that it is the scientifically preferred result.
Systematic review workflow for peak classification
- Confirm the run is valid: review the allelic ladder, internal size standard, spectral performance and all relevant controls.
- Inspect raw and analysed traces: identify unusual peak width, shoulders, clipping, baseline fluctuations and synchronized dye-channel anomalies.
- Locate candidate peaks precisely: compare apparent allele size, repeat offset, scan positions and locus bins.
- Apply validated artefact expectations: evaluate stutter and adenylation using assay/locus information; do not import arbitrary literature ratios.
- Assess profile-wide consistency: consider allele sharing, peak balance, template amount, degradation, contamination and plausible contributors.
- Record uncertainty: label ambiguous observations and alternative explanations where they materially affect interpretation.
- Choose rework deliberately: determine whether a CE reinjection, reamplification, cleanup, new extraction or no repeat is justified.
- Document and review: retain original files, reasons for edited calls, repeat results and final interpretation decisions.
The objective is consistent, reproducible classification—not forcing every peak into a definitive category. In complex profiles, probabilistic approaches may represent uncertainty rather than relying on an all-or-nothing manual exclusion of peaks. Their use still requires validation of the relevant data treatment and artefact models. SWGDAM’s current interpretation and probabilistic-genotyping guidance provides the relevant scientific framework.
Validation, training and quality assurance
Laboratories should characterize artefacts in known-composition validation data across relevant loci, alleles, dye channels, DNA quantities, mixture ratios and detection conditions. This includes stutter ratios, saturation behaviour, pull-up performance, peak-width and sizing criteria, and the effects of low-template amplification. Such data help distinguish the expected analytical background from conditions requiring further investigation. Revisions to STR kits, CE programs, spectral calibration methods or software settings may require documented verification or revalidation.
The 2026 OSAC artifact terminology and NIST’s 2024 mixture review reinforce the need to understand artefact sources and interpretation uncertainty. In the United States, the FBI Quality Assurance Standards for Forensic DNA Testing Laboratories specify relevant quality and documented analysis requirements for laboratories within their scope; applicability outside that context depends on the governing accreditationAccreditation – a process by which a laboratory must prove to an accrediting agency that their processes, equipment, and employees are competent, credible, and accurate. The accrediting agency will inspect the laboratory and observe its Read Full Definition and jurisdiction. A classroom example must not replace a trained analyst, approved SOP or current laboratory validation results.
Reporting artefacts without overstating conclusions
Routine forensic reports do not need to list every artifact peak, but conclusions should reflect material data limitations. Internal case records should preserve the raw observations, classifications and reasons for excluding or considering signals. Where an unresolved peak materially changes whether a mixture or comparison can be interpreted, the report should state the limitation according to the laboratory’s reporting procedure.
An appropriate internal observation might be: “A low-level peak was observed at a position associated with the back-stutter of a prominent allele; the signal was assessed under the laboratory’s validated stutter and mixture interpretation criteria.” This accurately describes the evaluation without asserting that every signal at that position is stutter. Where a peak cannot be reliably classified, an analyst may need to describe uncertainty or refrain from a categorical comparison.
Do not state that a profile is “contamination-free” simply because controls pass. Likewise, a novel peak does not, by itself, establish a separate contributor or demonstrate how or when DNA was deposited. Source-level evidence and activity-level questions require different propositions and reasoning.
Frequently asked questions
Is every small peak one repeat shorter than a large STR allele stutter?
No. It occupies a stutter position, but the signal may also include a genuine allele from a minor contributor. Use validated locus- and allele-specific expectations and the whole-profile context.
How can pull-up be distinguished from a true allele?
Review aligned signals across dye channels, raw and analysed data, peak intensity, saturation and spectral calibration. Alignment supports an artefact explanation but is not conclusive in isolation.
What is the difference between −A and back stutter?
Incomplete adenylation produces a peak approximately 1 bp shorter than the fully adenylated product; ordinary back stutter is typically one STR repeat shorter, often 4 bp at tetranucleotide loci.
Does a drop-in peak always mean laboratory contamination?
No. An unexpected allele requires a documented assessment of possible donors, contamination, analytical artefacts and stochastic effects. Its origin cannot be established solely from its shape or failure to match an assumed donor.
Should a suspected spike always trigger re-amplification?
No. A transient CE detection event may be assessed using the original raw data and, if validated and necessary, reinjection. Re-amplification is a separate intervention appropriate to some PCR-related issues, not every detection anomaly.
Scientific references and further reading
View scientific references (11)
- National Institute of Standards and Technology (NIST). OSAC Lexicon: Artifact. Human Forensic Biology, entry added August 2026.
- SWGDAM. Interpretation Guidelines for Autosomal STR Typing by Forensic DNA Testing Laboratories (2021) and Guidelines for the Use of Probabilistic Genotyping with Autosomal STR Typing Results (2025).
- Butler JM, Iyer H, Press R, Taylor M, Vallone P, Willis S. DNA Mixture Interpretation: A NIST Scientific Foundation Review. NISTIR 8351. 2024.
- National Institute of Justice (NIJ). STR Data Analysis and Interpretation: Stutter. Archived training course.
- NIJ. STR Data Analysis and Interpretation: Pull-up. Archived training course.
- NIJ. STR Data Analysis and Interpretation: Spikes. Archived training course.
- NIJ. STR Data Analysis and Interpretation: Dye Blobs. Archived training course.
- Vallone PM, Steffen CR, Butler JM. Demonstration of Rapid Multiplex PCR Amplification Involving 16 Genetic Loci. Forensic ScienceDiscover the fascinating field of Forensic Science, the application of scientific principles to legal matters. This post delves into its many disciplines, from DNA analysis to crime scene investigation, its importance in the justice system, Read Full Definition International: Genetics. 2008.
- Gill P, Gusmão L, Haned H, et al. DNA Commission of the ISFG: Recommendations on the evaluation of STR typing results that may include drop-out and/or drop-in using probabilistic methods. Forensic Science International: Genetics. 2012.
- National Institute of Justice. STR Data Analysis and Interpretation: Extraneous Peaks. Archived training course.
- Federal Bureau of Investigation. Quality Assurance Standards for Forensic DNA Testing Laboratories. Effective July 1, 2025.