

Analytical and stochastic thresholds in forensic DNA DNA, or Deoxyribonucleic Acid, is the genetic material found in cells, composed of a double helix structure. It serves as the genetic blueprint for all living organisms. Read Full Definition interpretation help analysts make two different decisions: whether a fluorescent peak can be distinguished from baseline noise, and whether a detected peak provides sufficient information to assess the risk that its partner allele was not detected. Both decisions matter when interpreting single-source short tandem repeatA short tandem repeat is a microsatellite with repeat units that are 2 to 7 base pairs in length, with the number of repeats varying among individuals, making STRs effective for human identification purposes Read Full Definition (STR) profiles, low-template samples and mixtures. However, neither threshold turns an electropherogram into an automatically correct genotype.
- What is an analytical threshold in forensic STR analysis?
- What is a stochastic threshold?
- AT versus ST: the key differences
- Illustrated threshold regions: a synthetic exercise
- How does a laboratory establish an analytical threshold?
- 1. Examine relevant baseline noise
- 2. Choose and evaluate a statistical approach
- 3. Balance false peak calls against lost alleles
- 4. Verify the settings actually used
- How is a stochastic threshold validated?
- Worked example 1: two alleles are detected, but one is below ST
- Worked example 2: one weak allele and possible dropout
- Worked example 3: a mixture can have a high shared allele and missing minor data
- Worked example 4: a stutter-position peak exceeds AT
- AT, ST and probabilistic genotyping are not competing versions of the same rule
- Why threshold values differ between laboratories
- Practical validation and review checklist
- Common interpretation errors
- Key takeaways for forensic analysts and students
- Frequently asked questions
- Scientific references and further reading
- Related Simply Forensic guides
This guide explains analytical threshold (AT), stochastic threshold (ST), the principles behind laboratory validationValidation, often referred to as method validation, is a crucial process in the laboratory when introducing a new machine, technology, or analytical technique. It involves a series of systematic steps and assessments to ensure that Read Full Definition, their differences from stutter and peak-height ratio criteria, and how to evaluate difficult examples. It expands upon our STR electropherogram interpretation guide and mixture interpretation guide without repeating their full workflows. All numerical examples in this article are synthetic educational values. They are not approved decision limits for any laboratory.
KEY POINTS
- AT: a validated detection boundary separating candidate signals from baseline noise—not an allele-authentication test.
- ST: a validated criterion used, when appropriate, to address possible dropout of the sister allele of a heterozygote.
- In mixtures, a high shared peak does not establish that every contributor’s alleles
 Alleles are different forms of a gene resulting from mutations or variations in the DNA sequence or gene expression. They can be dominant (expressed with one copy) or recessive (expressed only with two copies). Read Full Definition were detected.
- Thresholds are specific to the validated analytical configuration; there is no universal RFU value.
- Continuous probabilistic-genotyping approaches use validated models of peak height, stutter and dropout rather than simply applying a binary ST to every locusA locus is the precise position of a gene on a chromosome. Different alleles of the same gene occupy the same locus. Read Full Definition.


What is an analytical threshold in forensic STR analysis?
An analytical threshold is the minimum signal height at or above which a detected peak can be reliably distinguished from the background variation of the detection system. Electropherograms express fluorescence intensity in relative fluorescence units (RFU). Noise arises from the analytical system and sample-processing conditions; a weak genuine allele can occur close to that noise. The NIST/OSAC analytical-threshold definition makes an essential distinction: peaks exceeding AT may be either artifacts or true alleles.
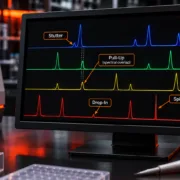
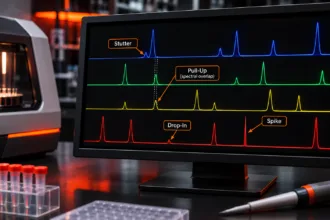
Consequently, the analystA designated person who examines and analyzes seized drugs or related materials, or directs such examinations to be done; independently has access to unsealed evidence in order to remove samples from the evidentiary material for Read Full Definition should not declare every peak above AT an allele. A stutter product, spectral pull-up, dye-associated artefact or contaminationContamination - The unwanted transfer of material from another source to a piece of physical evidence. The inadvertent touching of a weapon, thereby adding fingerprints to it is an example of evidence contamination. Read Full Definition signal may exceed the detection criterion. Assess peak shape, size, dye channel, locus position, controls and expected artefact behaviour before accepting a signal as an allele. AT is one element of the capillary electrophoresis review, not a replacement for that review.
Conversely, a signal below AT is not proof that the source lacked that allele. The target DNA might have been too scarce, degraded, inhibited or affected by stochastic sampling. The threshold describes the laboratory’s reliable detection rule, not the complete biological composition of the sample.
What is a stochastic threshold?
A stochastic threshold is a peak-height criterion used in validated binary interpretation approaches to assess the risk of allelic dropout: failure to detect one of the two alleles of a heterozygous genotype. When DNA template molecules are limited, PCR sampling and amplification can disproportionately favour one allele. The surviving allele may appear alone, creating a profile that resembles a homozygote even though the donor was heterozygous.
For a suitably characterized apparent single-source sample, an observed single allele below ST raises the possibility that its sister allele was not detected. A single peak above a validated ST may support treating the locus as homozygous under the laboratory’s stipulated assumptions and residual risk. It is never a mathematical proof that dropout was impossible. The NIST/OSAC definition of stochastic threshold explicitly highlights that mixtures require additional caution.
ST is not a second signal-detection threshold. A peak can be above AT and below ST: it is detectable but still falls in a range where the laboratory’s binary interpretation method requires consideration of dropout.
AT versus ST: the key differences
| Feature | Analytical threshold (AT) | Stochastic threshold (ST) |
|---|---|---|
| Primary purpose | Distinguish candidate peaks from baseline noise | Address uncertainty about an undetected sister allele |
Main underlying data Information in analog or digital form that can be transmitted or processed. Read Full Definition | Noise and detection performance under relevant analytical conditions | Known-genotype low-template dilution and dropout observations |
| Typical question | Is this signal detectable above validated background? | Could a partner allele of a heterozygote have dropped out? |
| Does crossing the threshold prove an allele? | No; artefacts and contamination may also cross AT | No; ST concerns dropout assessment, not peak authenticity |
| Single-source use | Determines which peak candidates can enter further interpretation | May inform whether a lone detected allele can be interpreted as homozygous |
| Mixture limitation | Allele sharing or artefacts complicate identification of component alleles | A composite peak above ST cannot rule out dropout of another contributor |
| Is a fixed universal RFU value appropriate? | No | No |
Other criteria—such as a stutter filter, peak-height ratio (PHR), or mixture-component separation criteria—answer still different questions. These values should not be substituted for AT or ST merely because they are also expressed numerically.
Illustrated threshold regions: a synthetic exercise
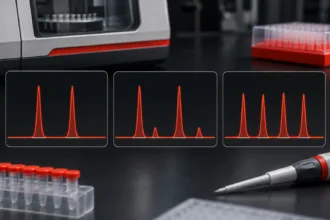
Imagine, solely for education, that a validated binary workflow has an AT of 100 RFU and an ST of 300 RFU. The four hypothetical signals below illustrate how their heights relate to these decision criteria.
FIGURE 1 · ILLUSTRATIVE AT AND ST REGIONS
AT 100 RFU
ST 300 RFU
| Hypothetical peak | Relative to AT = 100 | Relative to ST = 300 | What can be said? |
|---|---|---|---|
| 80 RFU | Below AT | Below ST | Does not meet the example’s validated routine peak-detection rule; an allele cannot be ruled out biologically |
| 180 RFU | Above AT | Below ST | Detectable candidate signal; if accepted as an allele, possible sister-allele dropout may need consideration |
| 420 RFU | Above AT | Above ST | Strong enough for the example’s single-source stochastic criterion, subject to context and validation |
| 900 RFU | Above both | Above ST | Strong observed signal, but not proof of identity, contributor count or mixture completeness |
Why borderline values matter: a 99 RFU signal and a 101 RFU signal are biologically similar in height. Under a binary threshold one falls below and one above the decision boundary. This does not mean there is a sudden biological change at 100 RFU; it means the laboratory has adopted a validated operational criterion with acknowledged classification risks. Analysts must follow approved procedures rather than move the threshold to obtain a preferred result.
How does a laboratory establish an analytical threshold?
1. Examine relevant baseline noise
The laboratory studies background fluctuation in negative controls and appropriate non-allelic regions of known-genotype samples. Data should represent the instrument, kit, analysis software, settings, fluorescent dye channels and analytical conditions to be used in casework. True alleles, expected stutter, pull-up and other identifiable artefacts must not simply be treated as random background when estimating noise.
2. Choose and evaluate a statistical approach
Published approaches use distributions of measured noise, mean and standard-deviation-based rules, or other empirically supported calculations. For a simplified, idealized distribution an analyst may encounter an expression of the form AT = mean noise + k × standard deviation. That is not a universal calculation: the correct statistical treatment depends on the underlying distribution, whether the measurements are independent, how peaks are selected, and the laboratory’s acceptable rate of noise exceeding the criterion.
Bregu and colleagues compared six approaches for setting analytical thresholds and observed that sample conditions and injection time affect detected noise. Their findings show why adopting a threshold from a different instrument or procedure without validation is unsafe. See the 2013 Journal of Forensic Sciences study.
3. Balance false peak calls against lost alleles
Setting AT too low may increase the number of background features that require review and may result in false allele candidates being accepted. Setting it too high suppresses genuine low-level alleles and may increase apparent dropout. Neither maximum sensitivityIn the context of laboratory equipment or analytical techniques, the term "sensitive" describes the capability of a machine or method to detect even very small amounts or concentrations of a substance. Sensitivity is a quantitative Read Full Definition nor maximum strictness alone yields an appropriate threshold. The chosen limit must be tested with independent known-composition samples, low-template material, controls and relevant case-type substrates.
4. Verify the settings actually used
The evidence Evidence is any form of proof, such as objects, materials, or scientific findings, presented to establish or disprove a fact in a legal proceeding. It is used to reconstruct events and link or exclude individuals Read Full Definition supporting a threshold can change when amplification conditions, capillary electrophoresis injection parameters, instrument optics, dye chemistry, analysis software or detection settings change. A uniform AT across all dye channels may be justified, but it should not be presumed if channel-specific background noise differs. Validation records should explain what conditions the threshold covers and when additional verification is necessary.
How is a stochastic threshold validated?
ST is typically investigated through replicate testing of known heterozygous genotypes at decreasing DNA inputs, particularly at quantities where peak imbalance and allele dropout occur. For each condition the laboratory records whether both alleles are detected, one allele drops below AT, or an entire locus fails to produce interpretable signals. Across loci, the analyst considers the peak height of the surviving allele when a partner is absent.
Methods described in the scientific literature and validation guidance include the height of the largest surviving allele associated with observed dropout, studies of peak-height balance, and logistic regression estimating the probability of dropout. A statistical model can be used to select a point corresponding to a laboratory-chosen acceptable residual dropout risk. A 1% example in a research paper is not a mandatory risk tolerance for every laboratory.
In a GlobalFiler validation using a SeqStudio analyzer, researchers reported AT 110 RFU and ST 890 RFU under their specific conditions. This is a valuable published demonstration of the importance of system-specific validation, not a recommended GlobalFiler threshold for other laboratories. Read the validation study.
The study design should capture enough low-template and replicate outcomes to estimate dropout risk meaningfully. Tests with exclusively high-quality, high-template samples cannot reveal the intended stochastic behaviour. Where laboratories employ different validated amplification volumes, cycle numbers or enhanced injection conditions, separate study or demonstrated equivalence may be necessary.
Worked example 1: two alleles are detected, but one is below ST
In an assumed single-source synthetic profile, a heterozygous locus displays allele 10 at 960 RFU and allele 12 at 210 RFU. With the teaching AT 100 RFU and ST 300 RFU, both alleles pass the analytical limit, although allele 12 is below ST.
Interpretation: If both peaks are genuine, two allele states are directly observed, so genotype 10,12 is supported at that locus. The lower peak should not be discarded simply because it is below ST. However, the striking heterozygote imbalance warrants attention to template amount, locus-specific balance expectations, possible artefacts or mixture information. ST is not a rule for erasing detected heterozygous alleles.
For illustration, the peak-height ratio is 210 ÷ 960 = 0.219, or about 21.9%. Whether that balance is acceptable for a single-source interpretation depends on the laboratory’s validation, and the ratio alone cannot tell the analyst the cause of imbalance.
Worked example 2: one weak allele and possible dropout
Consider one apparently genuine allele 15 at 220 RFU, with no second signal detected above the example AT. The peak exceeds AT but falls below the example ST. It would be scientifically premature to interpret the locus automatically as homozygous 15,15. The source could be homozygous or a heterozygote in which the partner allele was not detected. Other sample and locus information may help, but this single observation does not prove either explanation.
If the same single-source locus instead showed one genuine allele at 650 RFU, it would be above the example ST. A laboratory using that validated ST might treat the locus as a homozygous call under its stipulated conditions and acceptable residual risk. This does not mean that an absolute guarantee of no dropout exists. Review the whole profile, controls and sample quality before applying the conclusion.
Worked example 3: a mixture can have a high shared allele and missing minor data
Imagine two people contributed to a stain. At one locus both contributors might carry allele 10, producing a combined 1,400 RFU signal at that allele position. A second, unrelated minor allele position is observed at 180 RFU, while another expected minor allele might be below AT. The high allele-10 signal does not establish the signal height of either individual’s contribution on its own. It could combine two allelic contributions and potentially overlap with stutter or other signal.
Even though 1,400 RFU is well above the hypothetical ST, the minor contributor could still experience dropout. In mixtures, a peak’s total height does not reliably represent the separate heights of overlapping alleles. The peer-reviewed DNA mixture evaluation protocol emphasizes that a mixture peak above ST is not a guarantee of complete detection for every contributor. For worked contributor-count examples, see our number-of-contributors article.
Worked example 4: a stutter-position peak exceeds AT
At a tetranucleotide STR, imagine a main allele 12 peak of 2,000 RFU and a smaller peak at the allele-11 position of 190 RFU. The smaller peak exceeds the teaching AT of 100 RFU; its relative height is 190 ÷ 2,000 × 100 = 9.5%. This percentage is not enough to classify the smaller peak.
The lower signal could be back-stutter from allele 12, a genuine allele at the stutter position from another contributor, or a composite of both. Assessment requires validated locus-, allele- and assay-specific stutter expectations along with the full profile. Neither AT nor ST substitutes for a stutter filter or a mixture interpretation model. For further reading see our STR PCR amplification and artefacts guide.
AT, ST and probabilistic genotyping are not competing versions of the same rule
Binary interpretation applies specified detection and genotype criteria, often with an ST used to manage the possibility of dropout. Probabilistic genotyping (PG) evaluates observed DNA data under a mathematical model that may include peak-height distributions, stutter, dropout and other validated parameters. Some PG approaches use an analytical detection limit while explicitly modelling dropout rather than applying a fixed stochastic threshold as a binary pass/fail rule. What is required depends on the validated PG system, the data supplied and laboratory policy.
The SWGDAM 2025 probabilistic-genotyping guidance requires documented suitability criteria and validated methods. PG cannot automatically repair peak misclassification, failed controls, contamination or an unsuitable profile. Its likelihood-ratio output addresses stated propositions rather than giving a probability that a person committed an activity. A threshold may be an input or preprocessing criterion; it does not independently determine the evidential conclusion.
Why threshold values differ between laboratories
A study of 2021 laboratory practices reported default analytical thresholds ranging from 40 to 200 RFU and stochastic thresholds from 150 to 1,250 RFU among participating laboratories. Such ranges are descriptive observations of real practice, not a menu of acceptable values to choose from. The DNAmix 2021 laboratory-policy study cautions that values depend on amplification chemistry, cycling conditions and other analytical factors.
Differences can reflect instrument sensitivity, electrophoretic injection conditions, noise by channel, kit chemistry, analysis settings, template input, desired dropout-risk performance and use of binary versus probabilistic methods. Comparing two laboratories solely by which uses the lower AT or ST is not a valid measure of scientific quality. The pertinent question is whether the chosen criteria were internally validated and are applied consistently to the appropriate analytical conditions.
Practical validation and review checklist
- Define the intended analytical system: STR kit, PCR conditions, detection platform, injection program, dye configuration, analysis software and intended casework types.
- Study noise appropriately: use suitable blanks and known-genotype samples; exclude known allele and artefact regions from baseline-noise sampling.
- Assess detection performance: consider how candidate noise peaks and weak true alleles behave around possible AT values.
- Measure low-template stochastic effects: test replicate dilution series with known heterozygous profiles and document observed dropout and imbalance.
- Choose statistically justified criteria: state the method, assumptions, relevant uncertainty, acceptance criteria and impact of rounding.
- Check each analytical condition: address dye-channel differences, instrument variation and sensitivity-enhancing methods.
- Test case-type samples and mixtures: verify that thresholds yield defensible decisions when sharing, degradation, inhibition and artefacts occur.
- Document interpretation rules: specify what occurs when peaks straddle AT or ST, how artefacts are handled, and when data are unsuitable.
- Review changes: determine whether instrument servicing, software updates, revised injection settings or analytical modifications require additional checks.
- Retain technical review and training: thresholds support an analyst’s reasoning but cannot replace documented, competent interpretation.
For US laboratories subject to the FBI DNA Quality AssuranceQuality assurance (QA) is a comprehensive set of activities and processes to ensure the overall quality and reliability of the work conducted within a laboratory. QA is a proactive approach that focuses on improving scientific Read Full Definition Standards effective July 1, 2025, Standard 9.6 requires laboratory procedures supported by internal validation and threshold criteria appropriate to the interpretation model. SWGDAM guidelines provide related scientific guidance, but should not automatically be described as legally binding requirements in every jurisdiction.
Common interpretation errors
| Incorrect shortcut | Why it fails | Better interpretation |
|---|---|---|
| “A peak above AT is always a true allele.” | Stutter, pull-up and other artefacts can exceed AT | Classify peaks with artefact criteria, controls and whole-profile review |
| “A peak below AT proves an allele is absent.” | Non-detection does not establish biological absence | Recognize assay limitations and possible dropout |
| “Every allele below ST must be discarded.” | ST addresses potential missing sister alleles; it is not an allele deletion filter | Retain accepted alleles and apply appropriate dropout rules |
| “A mixture peak above ST rules out dropout.” | Multiple contributions may share the same peak position | Assess each plausible contributor scenario using validated methods |
| “A lower AT always means a better laboratory.” | Low limits can increase noise misclassification | Evaluate validated sensitivity and specificityIn the context of laboratory equipment or analytical techniques, the term "specific" describes the capability of a machine or method to accurately and selectively detect particular molecules or substances while minimizing interference from others. Specificity Read Full Definition together |
| “My laboratory can copy another kit’s RFU threshold.” | RFU depends on the entire analytical configuration | Perform relevant internal validation and verification |
Key takeaways for forensic analysts and students
The analytical threshold addresses signal detection; the stochastic threshold addresses the interpretation of possible undetected sister alleles in suitable workflows. Neither answers whether a profile identifies a particular person or what activity deposited the DNA. Borderline observations need validated, consistent handling, and mixtures require more than a high observed peak to exclude dropout. The defensibility of a threshold comes from its supporting experimental data and its use within a documented interpretation framework—not from a familiar RFU number.
Frequently asked questions
What is the difference between analytical and stochastic thresholds?
AT helps distinguish reliably detected peak candidates from background noise. ST, where applicable, helps assess whether a heterozygous partner allele could have dropped out. They address different sources of uncertainty.
Is 100 RFU a universal analytical threshold?
No. Some laboratories use 100 RFU, but no single number applies across all instruments, dye channels, STR kits, amplification and injection conditions or software configurations. The value must be supported by appropriate validation.
Does a single peak above ST always mean a homozygote?
Not absolutely. A validated single-source binary method may permit a homozygous interpretation above ST with an accepted residual risk, but unusual sample conditions or mixture sharing can invalidate a simplistic inference.
Can an allele be reported if its height is below ST?
Yes, depending on the laboratory’s validated rules. A genuine peak above AT but below ST can still be an observed allele; ST does not automatically mean that detected alleles must be ignored.
Does probabilistic genotyping eliminate the need to assess dropout?
No. Appropriate probabilistic systems model dropout and associated uncertainty, but analysts still need validated input criteria, model suitability checks and scientific review.
Scientific references and further reading
View scientific references (9)
- Scientific Working Group on DNA Analysis Methods (SWGDAM). Interpretation Guidelines for Autosomal STR Typing by Forensic DNA Testing Laboratories. 2021 revision.
- SWGDAM. Guidelines for the Use of Probabilistic Genotyping with Autosomal STR Typing Results. Approved April 11, 2025.
- Federal Bureau of Investigation. Quality Assurance Standards for Forensic DNA Testing Laboratories. Effective July 1, 2025; section 9.6.
- Butler JM, Iyer H, Press R, Taylor M, Vallone P, Willis S. DNA Mixture Interpretation: A NIST Scientific Foundation Review. NISTIR 8351. 2024.
- Bregu J, Conklin D, Coronado E, Terrill M, Cotton RW, Grgicak CM. Analytical Thresholds and Sensitivity: Establishing RFU Thresholds for Forensic DNA Analysis. J Forensic Sci. 2013;58(1):120–129.
- Gill P, Gusmão L, Haned H, et al. DNA commission of the International Society of Forensic Genetics: Recommendations on the evaluation of STR typing results that may include drop-out and/or drop-in using probabilistic methods. Forensic Sci Int Genet. 2012;6:679–688.
- Bieber FR, Buckleton JS, Budowle B, Butler JM, Coble MD. Evaluation of forensic DNA mixture evidence: protocol for evaluation, interpretation, and statistical calculations using the combined probability of inclusion. BMC Genetics. 2016;17:125.
- Brinkac LM, Richetelli N, Davoren JM, Bever RA, Hicklin RA. DNAmix 2021: Laboratory policies, procedures, and casework scenarios summary and dataset. Data in Brief. 2023;48:109150.
- Manabe S, Hashiyada M, Akane A. Internal validation for analytical and stochastic thresholds in the GlobalFiler system. Japanese Journal of Forensic ScienceDiscover the fascinating field of Forensic Science, the application of scientific principles to legal matters. This post delves into its many disciplines, from DNA analysis to crime scene investigation, its importance in the justice system, Read Full Definition and Technology. 2022;28(2):133–144 (released online in 2023).