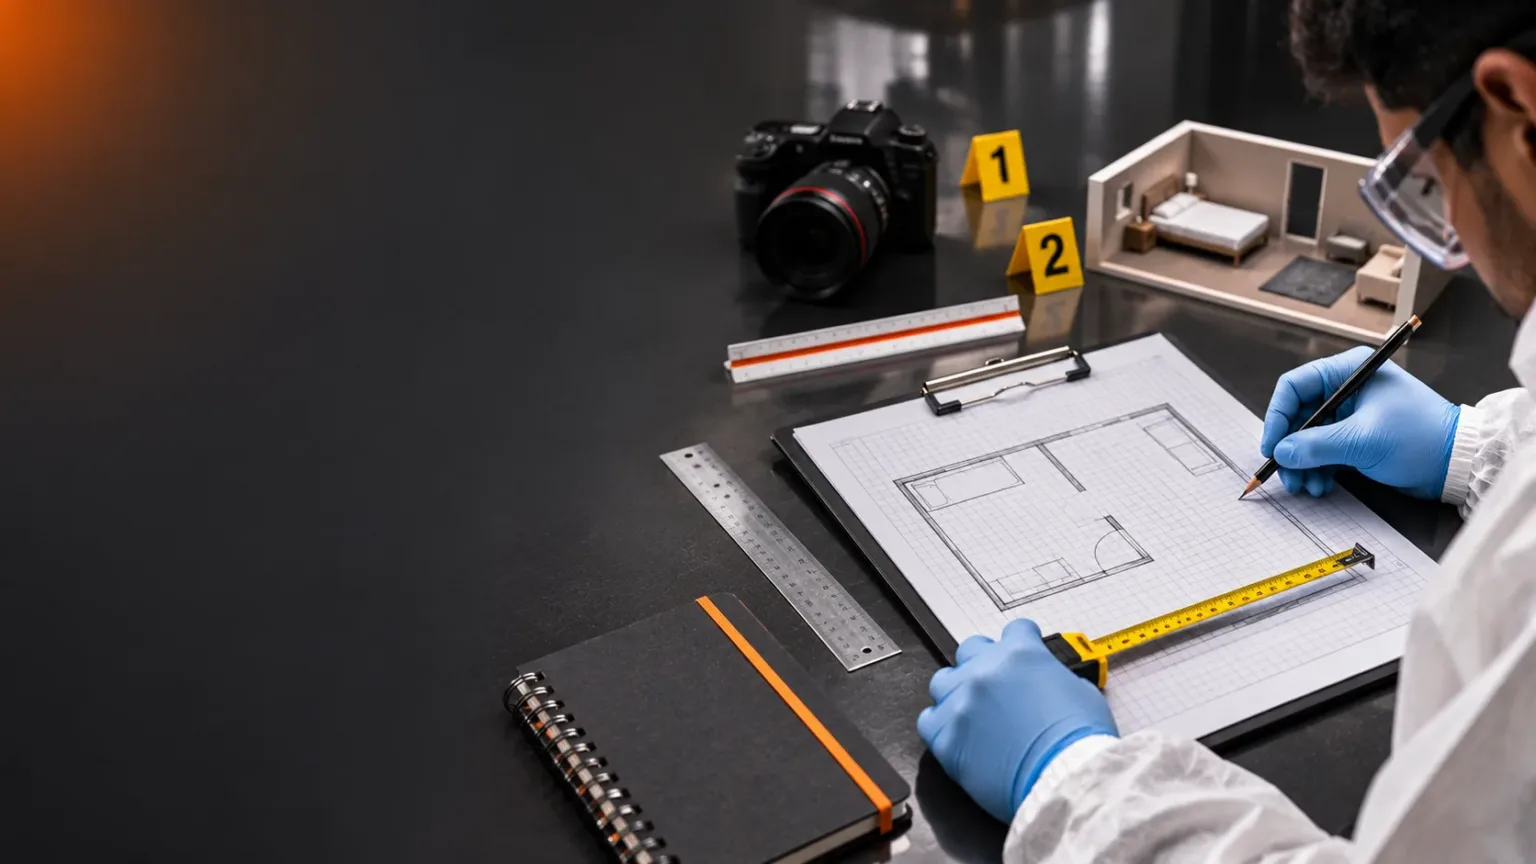
Crime scene sketching and measurements record where physical evidence, structures, objects and features were located in relation to one another. A scene photograph can preserve appearance, but a documented sketch makes spatial relationships explicit: how far an item was from a wall, which side of a fixed baseline it was on, or how an impression related to a doorway. A good diagram allows another examiner to understand and scrutinize the measurements without having to rely on the illustrator’s memory.
- What is a crime scene sketch, and why is it useful?
- Published forensic standards versus proposed diagramming standards
- Rough sketch versus finished crime scene diagram
- What must a usable sketch include?
- Types of crime scene views: plan, elevation, exploded and perspective
- Measurement tools and reference points
- Method 1: rectangular coordinates or two-wall measurements
- Method 2: baseline offsets
- Method 3: triangulation from two fixed points
- Method 4: polar coordinates — distance and angle
- How to draw a crime scene sketch to scale
- How to prepare a rough sketch and a checked finished diagram
- Digital scene mapping: laser scanners, total stations and photogrammetry
- Measurement accuracy, precision and uncertainty
- Common mistakes in forensic scene sketches
- Field sketching and measurement checklist
- Frequently asked questions
- References and technical guidance
Sketching is not an art contest and is not a replacement for photography or notes. It is a process of measuring, locating, labeling and preserving a traceable spatial record. Some diagrams are rough and explicitly not to scale. Others are finished, to-scale plans reconstructed from field measurements. Digital surveys may produce 2D drawings or 3D models; they still need appropriate accuracy controls and retained source data.[1][2][3]
This guide explains rough versus final sketches, plan and elevation views, the baseline/rectangular-coordinate, triangulation and polar-coordinate methods, drawing scale and instrument quality. Three fully worked metric examples, four original technical figures, common errors and FAQs are included. All dimensions in the examples are hypothetical teaching values, not measurements of a real incident.
Key Takeaways
A defensible scene diagram is a traceable measurement record, not just a neat illustration.
- Document the scene, evidence identifiers, orientation, fixed reference points and measurement method.
- Choose baseline, rectangular coordinates, triangulation or polar measurements according to the scene geometry; record directions and units.
- Check scale calculations and independent measurements before producing a final diagram.
- Preserve field sketches and source measurements, and distinguish observed locations from reconstruction hypotheses.
Key principle
What is a crime scene sketch, and why is it useful?
A crime scene sketch or diagram is a visual representation showing relevant scene features, item identities and spatial relationships. It may supplement photographs by making distances, orientation and scene layout easier to compare. It can also help examiners plan search and recovery, explain locations to a later reviewer, and check whether scene observations are internally consistent.[1][2][4]
A sketch does not, by itself, establish a sequence of events or prove a reconstruction. A measured distance establishes a geometric relationship at a stated time, not why an object was there or whether it was moved before attendance. For example, a cartridge case plotted 1.5 m from a chair does not prove where a shooter stood. Interpretive conclusions must depend on other observations, analyses, alternative explanations and their limitations.
Not all scenes require every sketch type or a polished final diagram. The NIST/OSAC proposed scene-documentation guidance recognizes that the scope of diagramming and whether a final product is needed depend on the scene and investigation. Agency rules and relevant published standards must be evaluated separately.[2][3]
Published forensic standards versus proposed diagramming standards
It is important not to call an OSAC Registry proposed standard a published, mandatory ANSI standard. As reviewed on 14 November 2026, OSAC 2023-N-0003, Standard for Diagramming Scenes, Version 2.1, and OSAC 2023-N-0002, Standard for Scene Documentation Procedures, Version 2.0, are on the OSAC Registry but remain in standards-development organization (SDO) development. Their technical recommendations are relevant but their adoption and legal force cannot be assumed.[2][3][7]
By comparison, ANSI/ASB Standard 159-24 (scene investigation and reconstruction foundations) and ANSI/ASB Standard 195-25 (initial response by scene investigators) are published standards. ANSI/ASB Standard 196-26 is a published specialist standard for the documentation and processing of shooting scenes. None of those references removes the need to check local regulations, laboratory procedures and any requirements adopted by the investigating organization.[4][5][6]
Rough sketch versus finished crime scene diagram
A rough sketch is generally prepared at the scene. It shows relevant features, evidence numbers and original measurements, and may be marked not to scale. Rough does not mean careless or reconstructed from a guess: it must be legible enough to allow the measurements and item locations to be understood and checked. Preserve the original even if a later drawing corrects a transcription or plotting error.[1][3]
A finished sketch or diagram presents selected information clearly. It may be drawn to scale on paper or produced in software using verified measurements. It should identify the scale or state unambiguously if not to scale. The person preparing or checking the finished product should be identifiable and its relationship to the field records should be traceable. A computer file is not inherently unalterable; digital files require version and retention controls.
| Feature | Rough field sketch | Finished diagram |
|---|---|---|
| Purpose | Capture measured field facts and item locations | Communicate a checked layout clearly |
| Scale | Usually not to scale; measurements written explicitly | Often to scale; scale or limitation stated |
| Annotations | Measurements, notes, arrows, corrections, references | Readable labels, legend, selected dimensions and methods |
| Corrections | Retain original record and identify legitimate changes | Versioned and traceable to source measurements |
| Key risk | Missing datum, units or unrecoverable notes | Appearance of precision not supported by original data |
What must a usable sketch include?
A practical drawing should ordinarily show the case/exhibit identifier, scene address or area designation, date of relevant recording, sketcher’s name/identifier, viewpoint (plan/elevation/other), north or another clear orientation convention, walls or other relevant boundaries, fixed reference points, dimensions and measurement units, evidence identifiers and a legend. Include the scale or not to scale notation as applicable. Describe the measurement method and its starting datum in the notes or drawing.[1][2]
For 3D or complex scenes, separate diagrams may be necessary to show floor layout, wall elevations, vertical differences, nearby buildings, or the relationship of a scene to a wider area. A floor plan alone does not communicate heights, overhead features or the sloping geometry of an exterior site.
Marking not to scale must not be used to hide guessed distances. Likewise, a sketch marked 1:50 does not acquire true scale simply because its objects look proportional. The depicted geometry must be plotted from supported measurements and checked using a defined printing or output size.
Types of crime scene views: plan, elevation, exploded and perspective
Plan view looks downward from above. It is useful for floor layout, doors, furniture positions and evidence locations on a horizontal reference plane. Elevation view depicts a vertical wall or side-facing plane, useful for heights of marks on a wall, windows or vertical impressions. Exploded (fold-out) views can show multiple room surfaces laid out in related planes. Perspective or 3D views communicate visual depth but still need documented geometry if distances will be inferred.[2][3]
Choose the view that answers the spatial question. A cartridge case on a floor may be well served by a plan view; a mark 1.4 m above the finished floor on a wall needs a vertical measurement or elevation. Several different diagrams may form one scene record.
Measurement tools and reference points
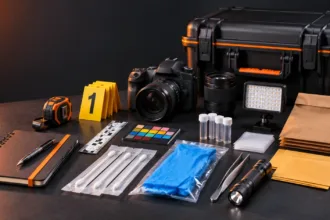
Appropriate instruments can include a measuring tape, rule, laser distance meter, total station, compass/angle device, calibrated photographic scale, terrestrial laser scanner or photogrammetric system. Selection depends on expected accuracy, length, obstacles, environmental conditions and the operator’s competence. A tape that sags, a laser that targets the wrong surface or a compass used near magnetic interference can introduce error.[1][2]
A datum is the origin or fixed reference from which locations are described. Prefer stable, unmistakable reference features. A moving chair or temporary evidence placard is usually a poor datum unless its position is independently documented and held fixed. Identify the exact corner, edge or point used; ‘measured from the wall’ is ambiguous when the wall has thickness, trim or an irregular surface.
Keep one measurement unit system within a given diagram. If an item has height, measure and record the height relative to the floor or other stated reference plane rather than assuming that a plan-view distance locates it in three dimensions. Record where on the object the distance terminates: centre, near edge, tip, impact point or other defined location.
No single quarter-inch accuracy rule is universal. The older NIJ training guide includes that example, while later OSAC proposed guidance treats precision and rounding as matters to be set by procedure and measurement purpose. AccuracyIn scientific and measurement contexts, "accuracy" refers to the degree of proximity or closeness between a measured value and the true or actual value of Read Full Definition, resolution and uncertainty are different concepts; recording many decimal places does not guarantee that the observation is accurate.[1][2]
Method 1: rectangular coordinates or two-wall measurements
The rectangular-coordinate method describes a location by two perpendicular distances from known reference axes or walls. It works well in rooms with reasonably straight, mutually perpendicular boundaries. Confirm the geometry rather than assuming two walls form a right angle. For a plan view, a point may be expressed as (x,y), with x measured eastward from a west reference and y northward from a south reference. Fixed coordinates are clearer than changing the description for every exhibit.[2]
In a simple room, measure its dimensions, select the reference corner and record an item’s position along the two axes. For a measurement to a wall rather than the actual axis, note any displacement or obstruction. Repeated checks from opposite walls or additional fixed references can identify transcription or placement errors.
Worked example 1: locating an exhibit inside a room
Consider a rectangular room measuring 6.0 m wide (east–west) and 4.0 m deep (south–north). An item, labelled E, has its defined centre 2.4 m from the west wall and 1.6 m from the south wall, with both offsets measured perpendicular to the relevant wall. With the southwest inside corner as origin, its coordinates are E = (2.4, 1.6) m.
Room width (west → east): 6.0 m · Depth (south → north): 4.0 m
The centre of evidence E is 2.4 m from the west wall and 1.6 m from the south wall: (x,y) = (2.4, 1.6) m. Display schematic is proportioned but not a calibrated printable scale drawing; rely on recorded measurements.
For a simple quality check, the item should be 3.6 m from the east wall (6.0 − 2.4) and 2.4 m from the north wall (4.0 − 1.6), subject to the actual room geometry and measuring conventions. These checks are useful for discovering recording mistakes, but they do not substitute for independently observing the distances if accuracy is critical.
Method 2: baseline offsets
A baseline is a known, marked line, often established between two stable points. The location of an item is described by its distance along the line from the chosen origin and a perpendicular offset from the line to the item. This may help when the outline of the scene is irregular or measuring directly from room walls is impractical. Identify both baseline endpoints, the baseline direction, the side of the offset and whether the measurement is horizontal or along a sloping surface.[2]
For example, an item at an along-baseline distance of 3.2 m from point A and a 1.1 m perpendicular offset to the left of the A→B direction is recorded as 3.2 m from A along AB; 1.1 m left of AB. Recording only “3.2 and 1.1 m” would be ambiguous. Also check that the two endpoints remain identifiable after temporary tapes or markers have been removed.
The baseline technique is closely related to rectangular coordinates. Some training sources treat them as the same family of methods; the underlying operations are what must be described.
Method 3: triangulation from two fixed points
Triangulation in a basic scene sketch measures an item’s straight-line distance from two identified fixed reference points A and B whose separation is also known. On a single plane, these lengths determine the intersection of two distance circles. There are generally two mirrored solutions, one on each side of AB; the diagram or notes must establish which side the evidence occupied. Very narrow intersection angles can make location estimates sensitive to measurement errors.[2]
Worked example 2: a 3–4–5 m triangle
Let the fixed reference points A and B lie 5.00 m apart on a level reference plane. EvidenceEvidence is any form of proof, such as objects, materials, or scientific findings, presented to establish or disprove a fact in a legal proceeding. It Read Full Definition point E was measured 3.00 m from A and 4.00 m from B, on the recorded north side of line AB. Treating A as (0,0) and B as (5,0), the along-baseline coordinate is:
x = (AE² − BE² + AB²)/(2 × AB) = (9 − 16 + 25)/10 = 1.80 m.
The perpendicular coordinate is y = √(AE² − x²) = √(9 − 3.24) = 2.40 m. Thus E is at (1.80, 2.40) m relative to A and AB. Check: √(1.8² + 2.4²) = 3.0 m from A, and √((5 − 1.8)² + 2.4²) = 4.0 m from B.
Measured: AB = 5.00 m, AE = 3.00 m, BE = 4.00 m. A and B are fixed references. Calculated: E is 1.80 m along AB from A and 2.40 m perpendicular to AB. The diagram shows E on one side of AB; record which side was observed to resolve the mirrored alternative.
The example is intentionally geometrically exact; real measurements include uncertainty. If A, B and E are not on the assumed reference plane, sloping tape distances may not describe the same 2D geometry. Record heights or use an appropriate spatial method when required.
Method 4: polar coordinates — distance and angle
A polar method identifies a point by its distance from a known station and a measured direction or angle. A bearing or azimuth normally follows a stated convention, such as clockwise degrees from north; do not substitute an angle measured from an east–west line without recording the change. The reference direction, coordinate system, units and angle instrument must be stated.[2]
Worked example 3: locating a point from a single station
A reference station O is set at the origin. An object is recorded 5.00 m from O at a bearing of 36.87° clockwise from north on a level plane. Its approximate east and north offsets are x = 5 × sin(36.87°) ≈ 3.00 m and y = 5 × cos(36.87°) ≈ 4.00 m. The result should be reported at a precision supported by the distance and angular observations, not as mathematically perfect coordinates.
A compass bearing can be affected by local magnetic sources. The distinction between magnetic, true and grid north may matter in outdoor mapping. Indoor geometry or complex terrain may favour other approaches. Use an independent check or additional reference when the decision depends on precise position.
How to draw a crime scene sketch to scale
The scale is the ratio of a dimension shown on the drawing to the corresponding real-world dimension, expressed in the same units. At 1:50, 1 cm on the drawing represents 50 cm at the scene. At 1:100, 1 cm on the drawing represents 1 m. The chosen scale must accommodate the longest dimension, relevant detail, labels and intended page size.
Using the 6.0 m × 4.0 m room above, a 1:50 drawing would occupy 12 cm × 8 cm before including margins and labels. The point at E = (2.4, 1.6) m would plot at (4.8 cm, 3.2 cm) from the designated drawing origin.
6.0 × 4.0 m
600 × 400 cm
1 : 50
1 cm on paper = 50 cm actual
12 × 8 cm
600/50 and 400/50
For point E at (2.4 m, 1.6 m), place the point 4.8 cm from the drawn west wall and 3.2 cm from the drawn south wall. A screen image can be resized, so these are instructions for a physical 1:50 drawing, not claims about the size on a device.
A responsive web image is not reliably 1:50. Browsers and phones resize diagrams. Present the nominal drawing scale, dimensions and—where appropriate—a verified graphic scale in a controlled output such as a PDF with explicit printed dimensions. A photograph of graph paper is not evidence that the original drawing was accurately scaled.
How to prepare a rough sketch and a checked finished diagram
First, assess the scene and select viewpoints and reference locations consistent with safety and preservation. Photograph relevant features before alteration where practical, then capture rough plans and actual measurements. Label evidence items consistently with the evidence register. Record any object already moved by emergency responders and distinguish current from observed original positions.
Before leaving, check whether the room or boundary dimensions agree with the sketch, whether every measurement has units and start/end points, and whether independent rechecks are needed. Retain source notes and photographs. A finished diagram should be made from the field record, not from remembered proportions. Preserve revised versions and their basis when a transcription, sign or plotting error is corrected.[1][3][4]
Capture intact context
Measure and identify datums
Cross-check dimensions and notes
Show scale, legend and orientation
Retain original source data and revisions
Illustrative workflow. Documentation is continuous; sequence may change for safety and vulnerable evidence. A revised drawing must remain traceable to its measurements and source records.
Where a diagram serves a later reconstruction, the original scene record should remain distinct from a hypothesis-specific illustration. Adding estimated movements, trajectories or alternative configurations can be useful for an explanation, but those additions must be clearly labelled as interpretive or hypothetical rather than measured observations.
Digital scene mapping: laser scanners, total stations and photogrammetry
A total station records selected points using distance and angle measurements. Terrestrial laser scanning can acquire dense 3D point clouds; mobile mapping and photogrammetry can provide other spatial products. GNSS may assist at appropriate outdoor scenes, but satellite-derived positioning can be unreliable indoors or near obstructing structures. The proposed OSAC diagramming document lists these technologies as possible measurement approaches rather than declaring one universally superior.[2]
Digital instruments introduce their own checks: calibration and maintenance, registration of multiple scans, reference coordinates, coverage gaps, reflective or transparent surfaces, changing geometry, software transformations, retained source data and the need for trained operators. An attractive textured 3D model can still be inaccurate or incomplete. Keep the original scans/images and document processing decisions and versions.
Drone imagery can support wide-area context when lawful and properly collected. It is not an automatic replacement for close measured documentation. Some reconstruction tasks require specialist metrology and validation beyond ordinary diagramming.
Measurement accuracy, precision and uncertainty
Resolution describes the smallest change an instrument displays; precision concerns the consistency of repeat observations; accuracy concerns closeness to the relevant true value; measurement uncertainty expresses the doubt associated with a measurement according to the appropriate method. These concepts should not be treated as synonyms. A laser distance meter displaying 0.001 m does not guarantee millimetre accuracy for every target.
Sources of discrepancy include tape sag or tension, a tape not held perpendicular to a baseline, poorly defined evidence centres, uneven floors, incorrect height references, transcription errors, changed scene objects and rounding. Repeated measures, independent checks and appropriate instrument verification can help identify problems; they do not remove all uncertainty.[1][2]
Use recorded precision that matches the method and investigation. If a measured item spans an irregular surface, define how its position is represented. If numerical results will support trajectory modelling or collision reconstruction, use an appropriately validated specialist measurement method rather than treating an educational hand sketch as sufficient.
Common mistakes in forensic scene sketches
Myth
A description like “near the door” is a reproducible evidence location.
Reality
Descriptions without stable, measured reference points cannot reliably establish where an exhibit was found.
Myth
A measurement recorded as 2.4 needs no additional information.
Reality
State measurement units and axis directions; an unlabeled value is ambiguous.
Myth
Walls and baselines can always be assumed to meet at right angles.
Reality
An assumed 90-degree geometry can produce incorrect offsets. Check the actual scene geometry.
Myth
Two distances in planar triangulation always locate a single unique point.
Reality
Two intersecting circles commonly yield mirrored positions. Record the side of the baseline or a further reference.
Myth
A resized web image or print retains its nominal 1:50 scale.
Reality
Physical scale depends on output dimensions. Verify the final printed size or use a controlled graphic scale.
Myth
A finished diagram makes the rough field sketch unnecessary.
Reality
Retain original field sketches, notes and measurements as the measured basis of the final product.
Myth
Estimated reconstruction positions can be plotted as observed locations.
Reality
Distinguish measured observations from hypothetical or interpretive positions.
Myth
A three-dimensional software model is inherently accurate.
Reality
Verify instrument performance, scene coverage, survey geometry, registration and source data rather than relying on appearance.
Field sketching and measurement checklist
Educational self-review only: checking an item does not establish laboratory QC acceptance.
Frequently asked questions
Frequently Asked Questions
What is a crime scene sketch?
It is a graphical scene record showing relevant structures, object locations, evidence identifiers and their measured spatial relationships. It complements photographs and contemporaneous notes rather than replacing them.
Does every crime scene require a finished sketch?
No single worldwide rule requires a polished final sketch for every incident. Whether diagramming and a finished product are appropriate depends on the scene, scope, agency procedure and applicable requirements.
What is the difference between a rough sketch and a final sketch?
A rough sketch captures the original field observations and measurements, commonly without a drawn scale. A finished sketch communicates those facts clearly and may be drawn to a verified scale. Both should remain traceable and preserved.
How does the rectangular-coordinate method work?
An evidence point is located by two perpendicular offsets from defined reference axes or walls. Both datum locations and measurement directions must be stated; the method assumes or verifies the relevant geometry.
What is the baseline method in crime scene sketching?
A fixed line is established between identifiable points. Items are measured by distance along the baseline from a chosen endpoint and the perpendicular offset on a specified side.
Why are two fixed points necessary for triangulation?
Distances from two known reference points establish the intersection of two circles on a plane. Typically two mirrored positions satisfy those lengths, so the side or another reference must be documented.
Can triangulation measure an object on a different height level?
Basic two-dimensional triangulation assumes a stated measurement plane. Differences in elevation or sloped tape measurements require height information or a suitable 3D method to avoid an incorrect plotted position.
How do you calculate a sketch at 1:50?
Convert real dimensions to the same units and divide by 50. A 6.0 m × 4.0 m room becomes 12 cm × 8 cm on paper. Resizing a digital image breaks that physical scale unless output dimensions are controlled.
Is every scene measurement required to be accurate within a quarter inch?
No. An older NIJ guide includes a quarter-inch example, but the required precision and accuracy depend on the task, instrument, procedure and intended use. Do not apply one numerical tolerance universally.
Can a 3D laser scanner replace handwritten sketches?
A scanner may create detailed spatial data, but requires suitable equipment, training, registration, coverage assessment, quality checks and retained source data. The appropriate output depends on the scene and purpose.
What information belongs in the sketch legend and title block?
A clear title or scene description, case/diagram identifiers, sketcher, relevant date, orientation, measurement units, scale or not-to-scale notation, evidence symbols and the source of reference measurements.
Are the new NIST/OSAC diagramming standards legally mandatory?
OSAC 2023-N-0002 and 2023-N-0003 are currently registered proposed documents in SDO development, not finished ANSI standards. Their usefulness does not by itself make them mandatory everywhere; check actual local adoption and requirements.
Related Simply Forensic Articles
References and technical guidance
Reviewed 14 November 2026. This educational discussion distinguishes published standards from OSAC Registry proposed standards, and mathematical teaching examples from measurements obtained at a real scene.
References & Sources
Show referencesHide references
- National Institute of Justice / Bureau of Justice Assistance. Crime Scene Investigation: A Guide for Law Enforcement (2013). Source
- NIST/OSAC. OSAC 2023-N-0003 Standard for Diagramming Scenes, Version 2.1 (May 2025). Proposed standard; in SDO development. Source
- NIST/OSAC. OSAC 2023-N-0002 Standard for Scene Documentation Procedures, Version 2.0 (January 2024). Proposed standard; in SDO development. Source
- NIST/OSAC. ANSI/ASB Standard 159-24: Scene Investigation and Reconstruction—Foundational Principles (2024). Published standard. Source
- NIST/OSAC. ANSI/ASB Standard 195-25: Scene Response—Initial Response by Scene Investigators (2025). Published standard. Source
- NIST/OSAC. ANSI/ASB Standard 196-26: Documentation and Processing of Shooting Scenes (2026). Published standard. Source
- NIST/OSAC. ASB Standard 220-2x: Standard for Scene Documentation. Under SDO development, not a published ANSI/ASB standard. Source
- College of Policing. Investigation: Scene Strategy (Authorised Professional Practice). Source
Education and scope notice: This article is not a substitute for forensic survey training, instrument validation, measurement uncertainty evaluation, agency SOPs or jurisdiction-specific evidential requirements.